If there’s one word that stands in for the year 2020, it’s “coronavirus.” But the gaming industry is one of the few that come out on top of what was a challenging year.
With the 2018 and 2019 trend toward consolidation firmly established, the industry built on the progress it had made. In fact, 2020 set the all-time record for M&A and IPOs. One example is the rumors about a Roblox IPO going around since the middle of the year. While they haven’t yet pulled the trigger, they’re actively preparing for the move.
The hyper-casual genre has also taken hold. Always a fast business type, 2020 saw it take form and christen several strong new players.
Epic Games and Apple have shown us that monopolies won’t be so easily tolerated. More than likely, that will lead to reduced platform commissions, forcing them in turn to look for new revenue streams. Regulation in the gaming industry as a whole is moving up a notch, in fact.
The PlayStation 5 and Xbox Series X were released in 2020. While consoles are still sold in limited quantities, the new generation will once again change the industry for the better and pave the way for new trends.
In a word, 2020 was record-breaking. There was revenue, users, deals, and cash. But let’s take a look at the primary markets’ key figures.
| № | Country | Games market revenue, mln USD | Internet penetration (%) | Number of gamers (millions) | Mobile market, mln USD | Average yearly spending on mobile games (USD) | EF EPI (English Proficiency Index) |
| 1 | China | 44000 | 65.2% | 665 | 29000 | 49.2 | 52 (Moderate) |
| 2 | United States of America | 41300 | 90% | 190 | 14700 | 82 | 100,00 (Native) |
| 3 | Japan | 19500 | 93% | 75.3 | 11400 | 159.5 | 48,7 (Low) |
| 4 | South Korea | 7130 | 97% | 32.3 | 4030 | 129.2 | 54,5 (Moderate) |
| 5 | Germany | 6630 | 94% | 45.6 | 1760 | 43.9 | 61,6 (Very High) |
| 6 | UK | 6140 | 96% | 35.5 | 1890 | 61.6 | 100,00 (Native) |
| 7 | France | 5300 | 91% | 35.2 | 1420 | 33 | 55,9 (Moderate) |
| 8 | Canada | 3410 | 94% | 20.8 | 1210 | 66.1 | 100,00 (Native) |
| 9 | Spain | 2930 | 91% | 27.9 | 529 | 20.7 | 53,7 (Moderate) |
| 10 | Australia | 2250 | 89% | 12.8 | 1090 | 99.1 | 100 (Native) |
| 11 | India | 2250 | 45% | 312 | 2130 | 7 | 49,6 (Low) |
| 12 | Italy | 2179 | 83.7% | 35.5 | 683 | 20.9 | 54,7 (Moderate) |
| 13 | Russia | 2150 | 85% | 76.9 | 843 | 12.2 | 51.2 (Moderate) |
| 14 | Brazil | 1990 | 75% | 89.6 | 884 | 10.3 | 49 (Low) |
| 15 | Indonesia | 1740 | 73.7% | 111 | 1380 | 12.6 | 45,3 (Low) |
| 16 | Taiwan | 1550 | 90% | 15.8 | 866 | – | Low |
| 17 | Turkey | 1114 | 77.7% | 40.6 | 630 | 16 | 46,5 (Low) |
| 18 | Saudi Arabia | 1090 | 95.7% | 22.6 | 629 | 32.6 | 39,9 (Very Low) |
| 19 | Thailand | 1050 | 69.5% | 32 | 778 | 25.2 | 41,9 (Very Low) |
| 20 | Malaysia | 876 | 84.2% | 20.9 | 570 | 27.8 | 54,7 (Moderate) |
| 21 | Philippines | 770 | 67% | 50.7 | 564 | 12.5 | 56,2 (High) |
| 22 | Poland | 767 | 84.5% | 20 | 301 | 16.4 | 59,6 (High) |
| 23 | Vietnam | 693 | 70.3% | 47.1 | 495 | 10.8 | 57,3 (Low) |
| 24 | Iran | 566 | 70% | 38.8 | 335 | 10.4 | 48,3 (Low) |
| 25 | Hong Kong | 456 | 92% | 4.86 | 273 | 58.1 | 54,2 (Moderate) |
| 26 | Singapore | 399 | 90% | 3.85 | 256 | 67.6 | 61,1 (Very High) |
| 27 | United Arab Emirates | 344 | 99% | 6.78 | 214 | 33.1 | 47,2 (Very Low) |
| 28 | South Africa | 278 | 64% | 22 | 248 | 11.8 | 60,7 (Very High) |
| 29 | Nigeria | 179 | 50% | 37.3 | 164 | 4.6 | 53,7 (Moderate) |
Rankings Table Explained
- The countries are presented in descending order by total market volume.
- Average yearly spending on mobile games is calculated by dividing average yearly spending on video games by the number of mobile gamers.

Games Industry Facts
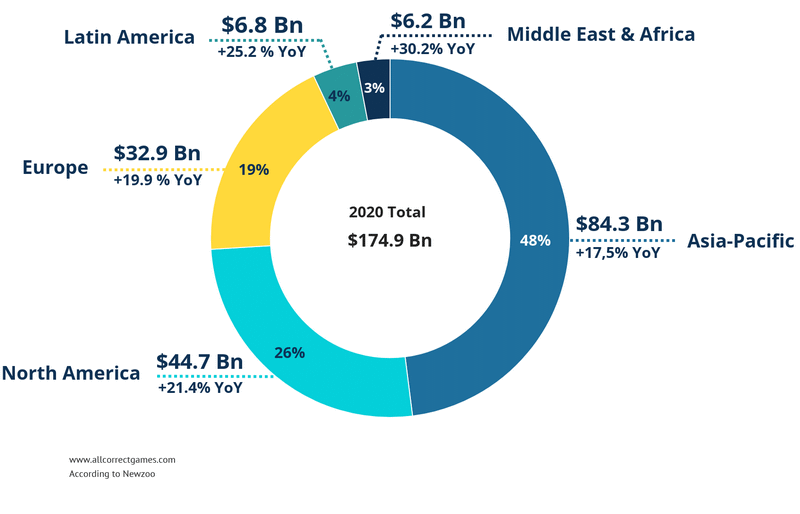
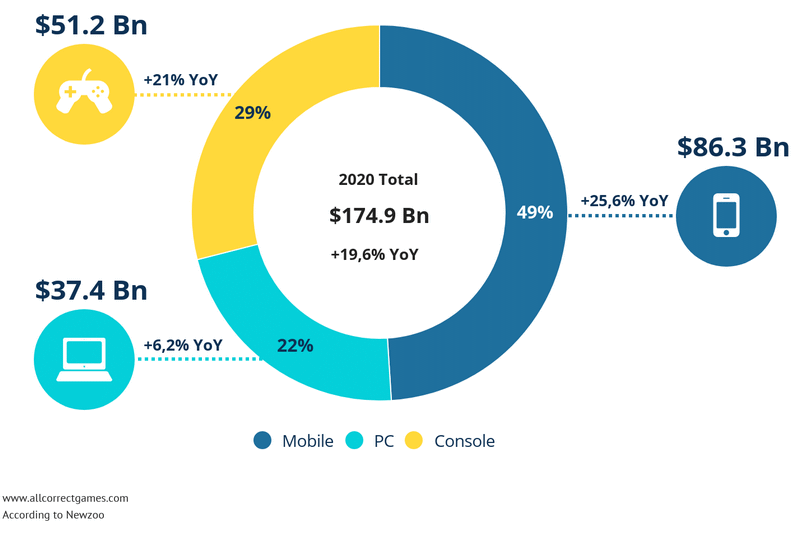
According to Newzoo, the market volume in 2020 was $174.9 billion. A large piece of the pie, 49%, was taken by the mobile games sector.
Overall, the gaming market enjoyed 19.6% growth. The main drivers were mobile games, as they outpaced the general market growth rate (+25.6% YoY). The console segment also saw a leap of 21% over the previous year.

The main trends of the industry in 2020 can be summarized as follows:
- Further consolidation of the gaming market.
- Added oversight and regulation.
- A fight for better terms between major developers and publishers on one side and platforms on the other.
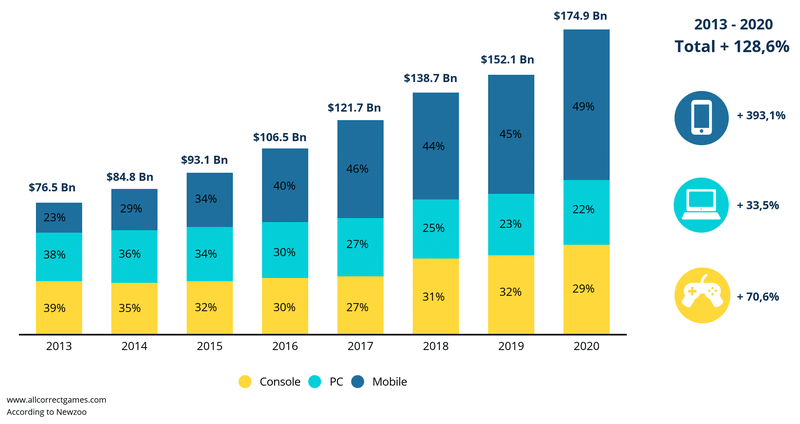
Growth Of Revenues By Segments

2021 is going to be full of surprises. Some highlights:
- A new approach to marketing on iOS devices and IDFA changes.
- The first big exclusives for next-gen consoles.
- A number of major IPOs (Roblox, for instance) and more M&A.
- Real-world stars jumping into gaming projects.
- The multiverse trend.
Research methodology
Here is a list of our main data sources for gaming markets (in descending order of reliability):
- Newzoo
- Publications by local games associations
- PwC
- Statista
- We Are Social
The indicators for each different country were analyzed and evaluated separately. We did our best to avoid predictive values, alternatively cross-checking forecasts across multiple sources simultaneously.
Macroeconomic data was mined from these sources:
- World Bank
- Worldometer
- EF EPI
- Statcounter
- Statista
Just like with the gaming market, we did not run predictive analysis, taking each country as a separate case while cross-checking our data.
It is worth noting that these materials are intended to be used exclusively for fact-finding purposes. The Allcorrect company does not bear any responsibility for potential losses or other negative consequences incurred by companies or individuals using these materials for their business or other purposes.


