Top 50 Mobile Games Markets
In 2016, the dominance of the gaming industry’s mobile segment became apparent. Since then, we have published the ratings of the most promising markets for mobile games developers.
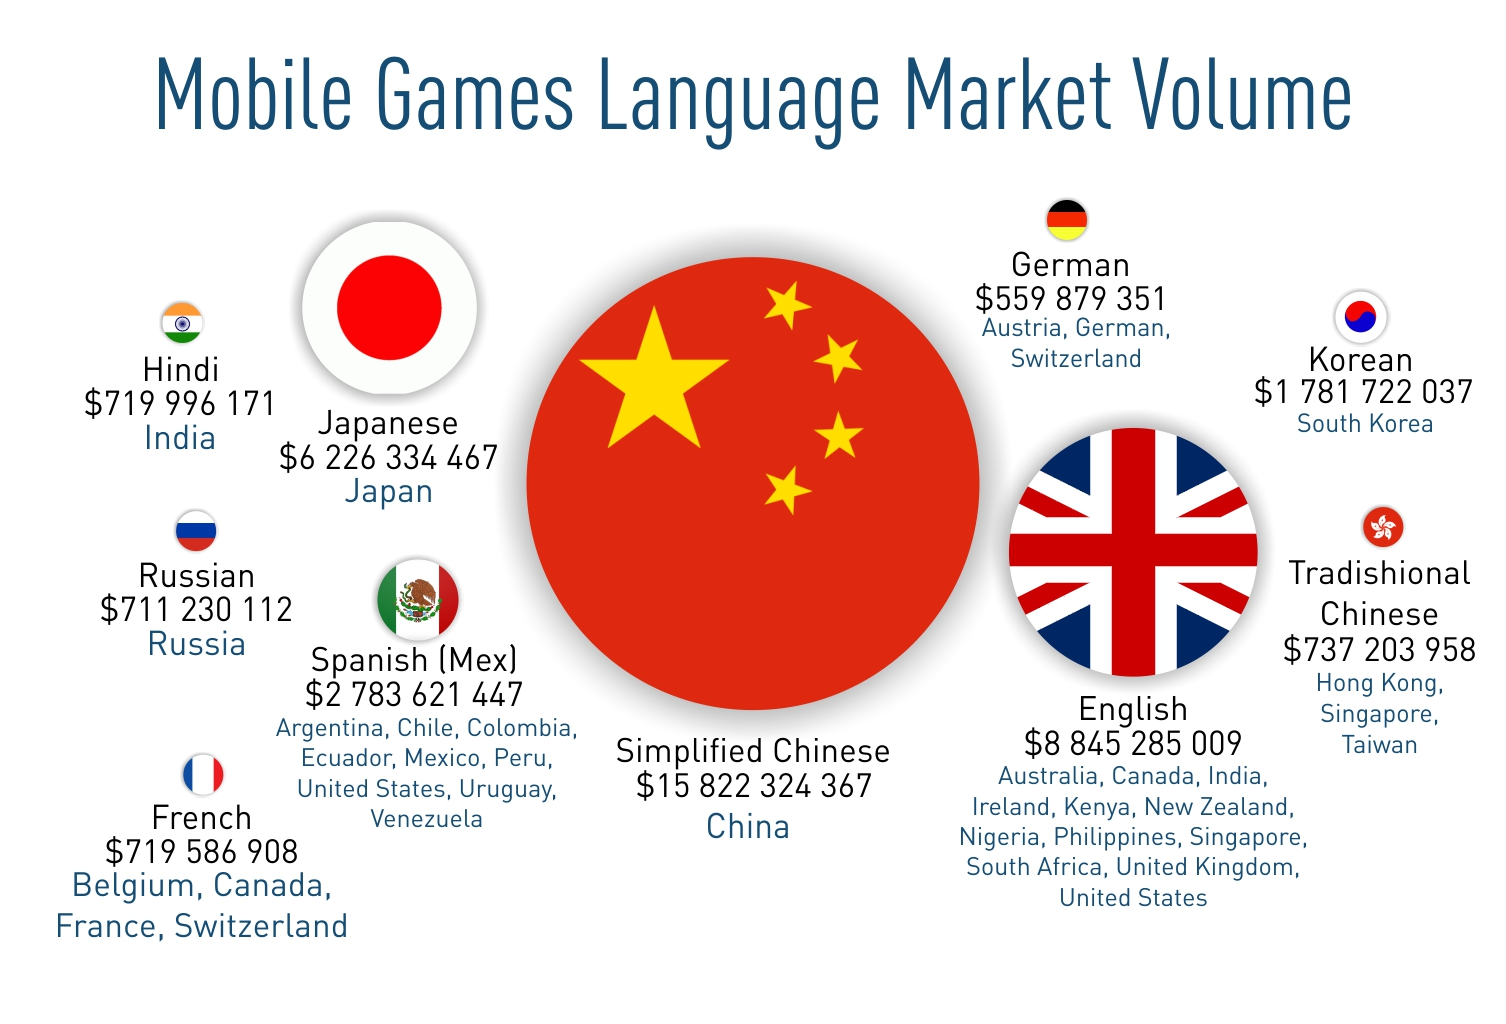
This year, we’ve added a language rating to the country rating since this is a particularly important parameter for developers to consider when localizing games.
| № | Country | Users | ARPU, USD | Revenue, USD | CPI, USD | Marginal profit, USD |
|---|---|---|---|---|---|---|
| 1 | China | 383 160 000 | 32,72 | 12 538 300 000 | 0,86 | 12 210 055 974 |
| 2 | USA | 139 990 000 | 53,56 | 7 497 600 000 | 2,49 | 7 148 410 451 |
| 3 | Japan | 68 470 000 | 89,88 | 6 153 900 000 | 2,81 | 5 961 425 635 |
| 4 | South Korea | 15 410 000 | 88,94 | 1 370 200 000 | 0,34 | 1 364 904 409 |
| 5 | UK | 17 710 000 | 57,06 | 1 010 300 000 | 2,04 | 974 193 013 |
| 6 | Russia | 46 140 000 | 12,74 | 587 900 000 | 0,23 | 577 189 085 |
| 7 | Mexico | 31 070 000 | 17,58 | 546 200 000 | 0,69 | 524 812 597 |
| 8 | Germany | 17 290 000 | 25,66 | 443 800 000 | 1,82 | 412 313 933 |
| 9 | France | 15 620 000 | 27,31 | 426 600 000 | 1,53 | 402 656 402 |
| 10 | India | 201 100 000 | 2,32 | 466 300 000 | 0,38 | 390 306 519 |
| 11 | Indonesia | 35 670 000 | 10,09 | 360 000 000 | 0,55 | 340 351 530 |
| 12 | Spain | 12 920 000 | 25,87 | 334 300 000 | 1,05 | 320 730 760 |
| 13 | Italy | 12 910 000 | 24,36 | 314 600 000 | 1,32 | 297 571 507 |
| 14 | Canada | 9 910 000 | 30,97 | 307 000 000 | 2,53 | 281 954 902 |
| 15 | Thailand | 9 770 000 | 28,25 | 276 100 000 | 0,63 | 269 986 067 |
| 16 | Brazil | 42 480 000 | 5,96 | 253 100 000 | 0,58 | 228 454 044 |
| 17 | Singapore | 1 870 000 | 104,50 | 195 700 000 | 2,14 | 191 700 591 |
| 18 | Argentina | 10 830 000 | 15,62 | 169 100 000 | 0,74 | 161 105 196 |
| 19 | Philippines | 10 620 000 | 14,97 | 159 000 000 | 0,67 | 151 894 816 |
| 20 | Vietnam | 13 770 000 | 9,34 | 128 700 000 | 0,51 | 121 703 712 |
| 21 | Hong Kong | 1 920 000 | 64,82 | 124 700 000 | 2,26 | 120 368 193 |
| 22 | Netherlands | 3 530 000 | 35,22 | 124 300 000 | 1,88 | 117 680 446 |
| 23 | Malaysia | 4 920 000 | 22,19 | 109 200 000 | 1,56 | 101 500 325 |
| 24 | Turkey | 15 160 000 | 7,68 | 116 400 000 | 1,03 | 100 854 721 |
| 25 | Poland | 6 550 000 | 15,01 | 98 300 000 | 1,07 | 91 273 190 |
| 26 | Australia | 5 520 000 | 18,00 | 99 300 000 | 3,03 | 82 573 443 |
| 27 | Saudi Arabia | 3 630 000 | 22,92 | 83 200 000 | 1,13 | 79 109 359 |
| 28 | Sweden | 2 820 000 | 29,73 | 84 000 000 | 1,97 | 78 454 111 |
| 29 | Belgium | 2 390 000 | 23,61 | 56 300 000 | 1,74 | 52 152 705 |
| 30 | Norway | 1 630 000 | 31,94 | 52 200 000 | 2,04 | 48 874 349 |
| 31 | Austria | 1 630 000 | 25,81 | 42 200 000 | 2,08 | 38 815 339 |
| 32 | Ireland | 1 290 000 | 31,05 | 39 900 000 | 1,65 | 37 768 569 |
| 33 | Switzerland | 1 780 000 | 21,59 | 38 500 000 | 2,45 | 34 143 992 |
| 34 | Denmark | 1 220 000 | 30,08 | 36 800 000 | 2,26 | 34 045 101 |
| 35 | Finland | 1 440 000 | 24,72 | 35 500 000 | 1,29 | 33 641 411 |
| 36 | Czech Republic | 2 040 000 | 14,69 | 30 000 000 | 0,79 | 28 384 249 |
| 37 | Israel | 1 130 000 | 25,23 | 28 600 000 | 0,93 | 27 549 292 |
| 38 | South Africa | 6 440 000 | 5,13 | 33 000 000 | 1,16 | 25 521 009 |
| 39 | Portugal | 1 680 000 | 16,03 | 26 900 000 | 1,04 | 25 158 018 |
| 40 | Romania | 1 960 000 | 10,16 | 19 900 000 | 0,80 | 18 329 315 |
| 41 | Hungary | 1 180 000 | 9,72 | 11 500 000 | 0,96 | 10 370 841 |
| 42 | Slovakia | 770 000 | 7,51 | 5 800 000 | 0,57 | 5 361 805 |
| 43 | Serbia | 600 000 | 6,53 | 3 900 000 | 0,80 | 3 420 261 |
| 44 | Croatia | 520 000 | 5,53 | 2 900 000 | 0,95 | 2 404 581 |
| 45 | Lithuania | 320 000 | 6,69 | 2 200 000 | 1,11 | 1 846 279 |
| 46 | Bulgaria | 590 000 | 3,80 | 2 200 000 | 0,89 | 1 674 063 |
| 47 | Slovenia | 270 000 | 6,78 | 1 800 000 | 1,02 | 1 523 856 |
| 48 | Estonia | 160 000 | 7,97 | 1 300 000 | 0,59 | 1 205 632 |
| 49 | Latvia | 230 000 | 5,73 | 1 300 000 | 0,98 | 1 073 701 |
METHODOLOGY FOR COMPILING A RATING ON THE PROFITABILITY OF MOBILE GAMES MARKETS:
- Countries and languages are placed in descending order of their relative profitability of the mobile games market.
- Marginal profit in this case is a relative indicator. It is the difference between the total market value and the cost per install for a mobile game across all users, determined using the formula: Marginal profit = Market revenue – Number of users × CPI.
- The number of users is the number of mobile games users in a specific country.
- In this case, ARPU (Average Revenue Per User) is the average revenue per user per year. The data source for revenue, number of players, and ARPU is the Statista portal. The ARPU figure, highlighted in blue, is predicted to fall, while the rest will increase at various rates.
- CPI (Cost Per Install) is the average cost for a user to install a game of any genre for Android or iOS in every country which is standardized to 100%, disregarding other platforms. The data source for CPI, as of March 2019 for the games rating in 2018, is the Chartboost platform. Data for March 2019 marked in green was provided by the analytical company Niko Partners.
- Statistics on the breakdown of mobile users by OS on smartphones and tablets were published by the StatCounter online service.
- Language market size was calculated with data for all countries that speak the target language with regard to the proportion of target language speakers in each population.
FACTS ABOUT THE MOBILE GAMES MARKET IN 2018
In 2018, the video games market generated USD 137.9 billion. Revenue from mobile games grew from 36% of the total amount in 2017 to 41% in 2018. Forecasts predict this figure will continue to grow, reaching 49% by 2021 (according to Newzoo).
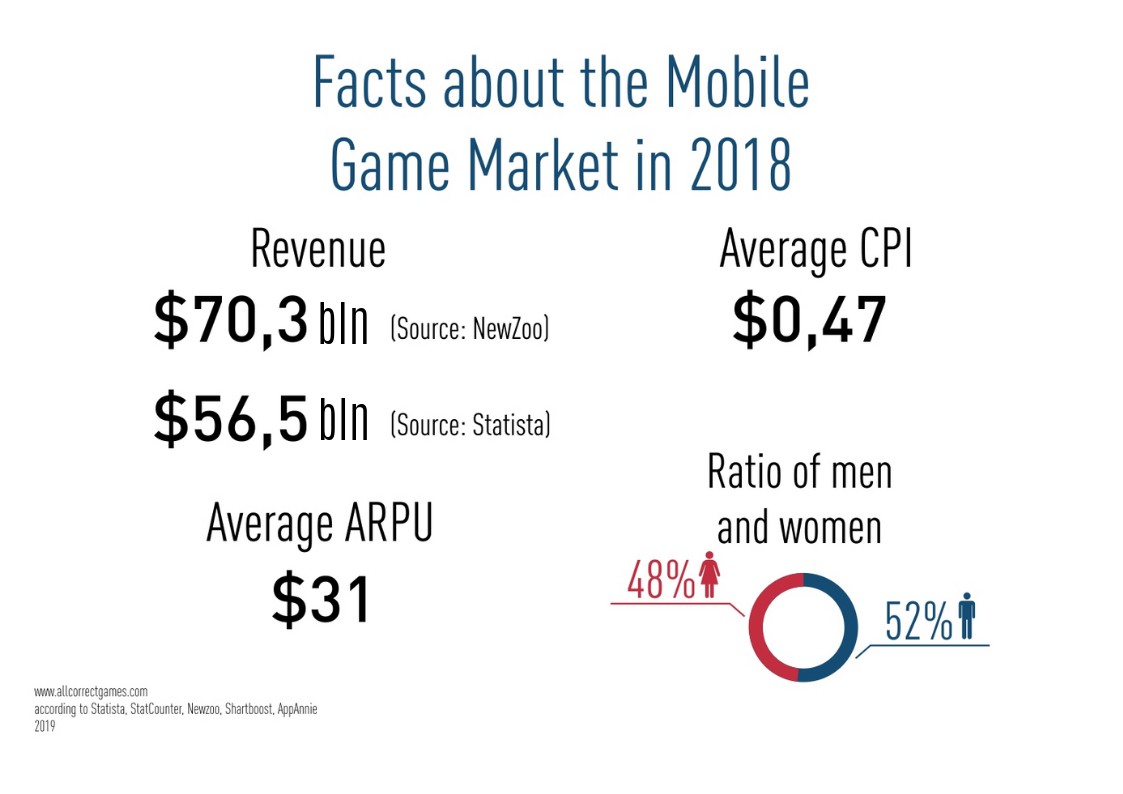
According to Chartboost, the average ARPU for 2018 was USD 31. The average CPI equaled USD 0.47.
As for the gender of mobile games users, there are slightly more men playing than women. In some countries, like the USA, there are considerably more women playing mobile games.
Several trends were observed in the mobile games market in 2018:
- Just like the year before, a large number of company mergers and acquisitions took place.
- Successful release of mobile games based on older games, franchises, and IP.
- Rapid growth of the Asian segment.
- Steady income growth from the Battle Royale and MOBA game genres.
- Development of e-sports and videogame streaming, including mobile games.
RESEARCH CHARACTERISTICS
For our research, we use data from Statista, App Annie, Priori Data, and Newzoo. It’s worth noting that the Statista portal corrected the data for some markets (India, Mexico, and USA) in 2017 and 2018, and these figures may change significantly. For some countries, the numbers from other sources such as Newzoo and App Annie may differ dramatically. Additionally, not a single analytics company has reliable data on the Chinese games market for Android for certain reasons.
In research like this, the profitability of the mobile games market is traditionally grouped by region (North America, Asia, Europe, etc.). Several countries are grouped together and examined as one.
However, we analyzed each country individually and ranked mobile games markets by attractiveness, a list that included 56 countries in 2019.
In addition, we endeavored to take into account the necessary costs for entering the market. To do so, we calculated the cost per install (CPI) for all users and subtracted it from the total income in each country. This allowed us to obtain data on the marginal profit for that market.
The term “users” is understood to mean active players (or accounts) registered in the chosen market.
These materials are intended for informational purposes only. The Allcorrect company does not bear any responsibility for potential losses or other negative consequences incurred by companies or individuals using this information for their business or for other purposes.
Allcorrect game localization studio
Localizing a game into the main languages increases its revenue by a factor of 1.9 (based on data from Google Europe and Allcorrect’s research).
Allcorrect is an ROI-based localization company. Our approach is based on finding profitable markets for developers and publishers and adapting games for target audiences, taking particular cultural aspects into account. Our goal is to make your games popular and your players happy.
We’ve been translating games since 2008, and we’ve localized over 968 projects during that time. Our portfolio includes localizations of large-scale AAA projects as well as indie games that have dominated the international market.