Who really earns money from game localization? We estimated the revenue of 47 companies and sized the game text localization market at $246 million. See who leads, where Allcorrect stands, and why experience doesn't always mean revenue.
This study was prepared and published by Allcorrect, which is also included in the dataset. Figures are modeled estimates for 2025.
Key takeaways
- What we compared: 47 game localization providers, ranked by estimated 2025 revenue from game text localization.
- Market size: we model the 2025 game text localization market at USD 246 million.
- Concentration: within this dataset, Keywords Studios, Side (formerly PTW) and Lionbridge account for about 60% of the modeled market; the top 10 for about 77%.
- Allcorrect: #6 by estimated text localization revenue (USD 7.2 million, about 3% of the market) and #2 by MobyGames credits (195 projects) in this dataset. Positions rest on modeled estimates and may shift with small revisions.
- Main insight: game credits and revenue are related, but neither is a quality score. A larger provider is not necessarily a better fit for your game.
In this article
Few public rankings publish revenue estimates by game localization provider.
Therefore, we decided to run our own analysis of the game outsourcing market, with a particular focus on localization. We used publicly available sources and our own research model to estimate the market structure. In our series of studies, you’ll find data from 2023 to 2025, along with a forecast for 2026. We will keep updating the data.
First, we identified active game localization providers using MobyGames and other public sources. We then estimated each provider’s 2025 game text localization revenue and ranked them by that estimate. The standard set of services provided by localizers usually includes text localization, voice-over, and localization testing; for this ranking, we looked exclusively at text localization.
The USD 246 million market figure is a modeled anchor: individual company estimates were scaled so that their sum matches it. In this model, the market is defined by the 47 providers in the table. These are model-based estimates, not audited figures, and they were not confirmed by the companies.
Game Localizers Ranking Table
This is a map of who earns what — not a report card on who translates best. Allcorrect publishes this research and is included in the dataset. The ranking compares modeled revenue, not translation quality. A company at #35 isn't necessarily a worse partner than one at #5.
| № | Company | Projects localized, MobyGames | Revenue reported USD M | Text loc. revenue USD M |
|---|---|---|---|---|
| 1 | Keywords Studios | 565 | 850 | 99.6 |
| 2 | Side (formerly PTW) ◆ | 150 | 349 | 30 |
| 3 | Lionbridge ◆ | 130 | 513.9 | 18.6 |
| 4 | QLOC | 136 | — | 8.4 |
| 5 | TransPerfect ◆ | 98 | 1,320 | 8 |
| 6 | Allcorrect | 195 | 8.1 | 7.2 |
| 7 | ACE Agency | 45 | — | 5.2 |
| 8 | Localsoft | 67 | — | 4.6 |
| 9 | Local Heroes Worldwide | 83 | — | 3.9 |
| 10 | Warlocs | 45 | — | 3.9 |
| 11 | Altagram Group | 47 | — | 3.5 |
| 12 | Roboto Global | 154 | 4.5 | 3.4 |
| 13 | 4-Real Intermedia | 49 | — | 3.2 |
| 14 | Inlingo | 12 | 3.9 | 3.2 |
| 15 | Gameloc Localisation Services | 35 | — | 3 |
| 16 | GameScribes | 31 | — | 2.8 |
| 17 | Locadile | 18 | — | 2.7 |
| 18 | Universally Speaking | 58 | 13 | 2.3 |
| 19 | LocalizeDirect | 90 | 2.8 | 2.3 |
| 20 | Logrus IT | 149 | 7.6 | 2.1 |
| 21 | Riotloc | 110 | 2.2 | 2 |
| 22 | The Most Games | 33 | 2.2 | 1.9 |
| 23 | Locpick Game Localization & Audio | 14 | — | 1.9 |
| 24 | Studio Umlaut | 15 | — | 1.8 |
| 25 | Level Up | 27 | — | 1.6 |
| 26 | Native Prime | 60 | 1.9 | 1.6 |
| 27 | Quoted Tradução e Localização | 18 | — | 1.6 |
| 28 | Aibell Game Localization | 28 | — | 1.5 |
| 29 | Levsha Games | 32 | 1.7 | 1.5 |
| 30 | Loki Games | 18 | — | 1.4 |
| 31 | Effective Media | 157 | — | 1.3 |
| 32 | Testronic Labs | 41 | 26.6 | 1.1 |
| 33 | DICO Co | 23 | — | 1.1 |
| 34 | Kinsha Co | 14 | — | 1 |
| 35 | Quantic Lab | 30 | 11.1 | 0.9 |
| 36 | Latis Global Communications ◆ | 34 | 5.9 | 0.9 |
| 37 | EC Innovations Inc ◆ | 21 | 53 | 0.8 |
| 38 | Pink Noise | 20 | — | 0.7 |
| 39 | Intac Ltd | 16 | — | 0.6 |
| 40 | GlobalWay ◆ | 16 | — | 0.6 |
| 41 | Globaloc | 16 | — | 0.6 |
| 42 | Wiitrans Network ◆ | 13 | — | 0.4 |
| 43 | RoundTable Studio ◆ | 13 | — | 0.4 |
| 44 | Alpha CRC ◆ | 22 | 31.1 | 0.3 |
| 45 | Loc & Load | 38 | — | 0.2 |
| 46 | S&H Entertainment Localization | 26 | — | 0.1 |
| 47 | DLM International | 21 | — | 0.1 |
Company experience doesn’t always correlate linearly with revenue. MobyGames credits are an important indicator of visibility and experience, but they don’t show project size, number of languages, word count, or the split between text localization and adjacent services. Large providers typically generate more revenue from text localization, but specialized studios can achieve meaningful revenue with fewer credits when their service mix is focused on text localization.
Shortlisting a partner? Share your target languages, content volume and release schedule. We'll discuss the scope, workflow and quality checks your project needs. You can also explore relevant game projects or see how our game localization service works.
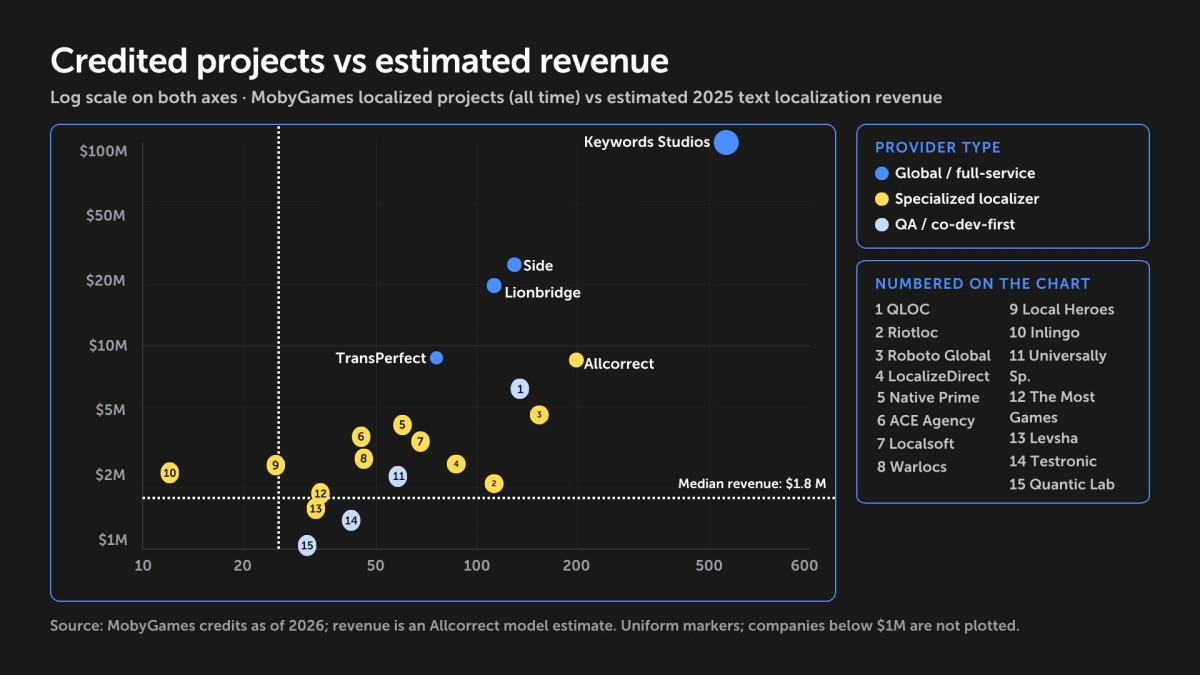
Public MobyGames game credits versus modeled 2025 game text localization revenue. Both axes use logarithmic scales. Marker size is uniform; colors show the three provider groups in the legend. Credits are cumulative, while revenue is estimated for one year. The chart plots a selection of providers; the full dataset is in the table above. This comparison does not measure translation quality or provider efficiency.
Source: Allcorrect research model, 2025; MobyGames credits.
How to Shortlist a Game Localization Partner
A ranking tells you who is large. A shortlist should tell you who fits your game. Use revenue and public credits to find candidates, then check them against your project.
| What to check | What to ask for |
|---|---|
| Genre and content | Examples close to your genre, tone and content type: UI, narrative, marketing or live ops |
| Languages | Exact source–target pairs, lead linguists per language and backup coverage |
| Capacity | Team availability for your dates, realistic throughput and an escalation plan |
| Context | How linguists receive screenshots, string IDs, character notes, a glossary and a style guide |
| LQA | Scope, build access, severity definitions, bug workflow and acceptance criteria |
| Tools and formats | Supported formats, delta updates, placeholder validation and API or TMS integration |
| AI and security | Which models are used, what data leaves your environment and who reviews the output |
| Cost | What the quote includes: translation, editing, PM, engineering, LQA and scope changes |
| Quality proof | A paid pilot using the same sample and the same scoring rubric for each shortlisted vendor |
Revenue shows a provider’s scale, not what you will pay. Note that the market figures in this article are in US dollars, while our pricing guide quotes per-word rates in euros: for common language pairs they range from about €0.06 to €0.17, depending on the language. The guide also explains how repeated text is priced. Word count, the number of languages and the amount of repeated text all move the final quote, so compare offers built on the same brief, not on company size.
How Big Is the Game Text Localization Market in 2025?
Our 2025 model covers eight game outsourcing segments totaling approximately USD 10.0 billion. Game text localization accounts for USD 246 million, or roughly 2.5% of that covered total. Here and below, the covered game outsourcing market is the scope of the Allcorrect model, not a measurement of the entire global gaming market.
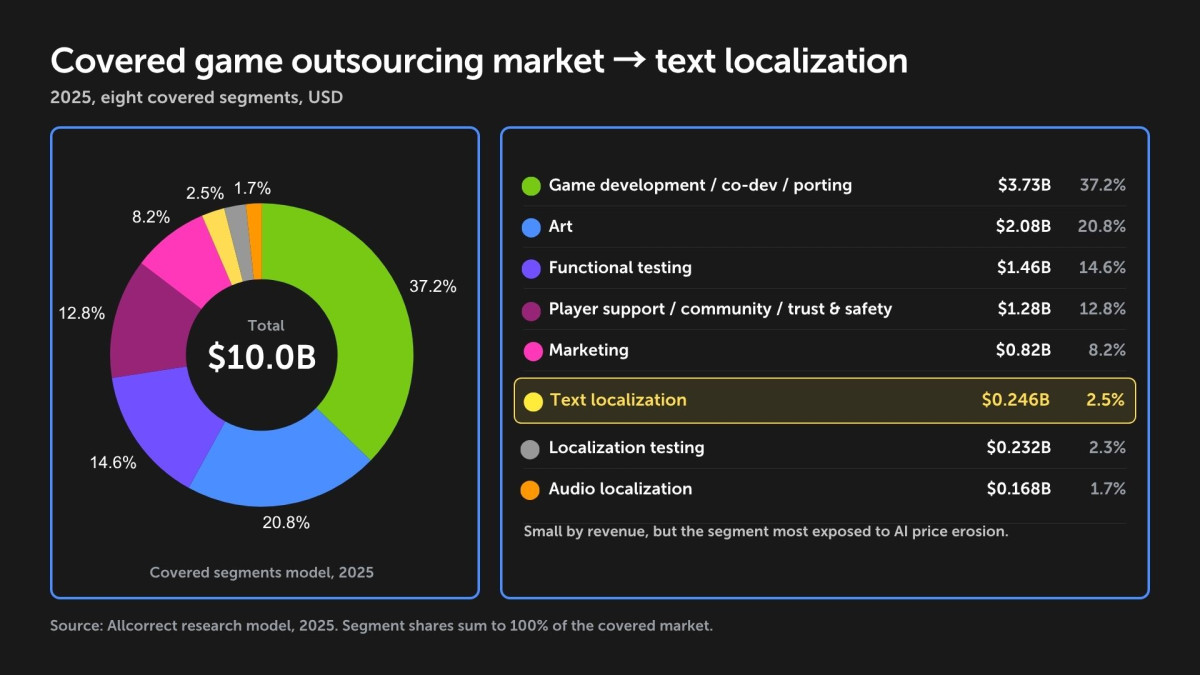
Market zoom-in from the covered game outsourcing market in 2025 (eight segments, approximately USD 10.0 billion in total) to the game text localization segment: USD 246 million, roughly 2.5% of the covered total.
Source: Allcorrect research model, covered game outsourcing segments, 2025. Figures in USD.
Revenue Mix by Company Type
Based on service mix and the degree of specialization in text localization, the companies in the study can be divided into four broad types: full-service game outsourcing platforms, global language service providers with a game vertical, specialized game localization studios, and QA/co-development-first companies with localization activity. Specialized localization studios typically derive most of their revenue, roughly 75% or more, from text localization, while for the other company types the text localization share is usually below about 30%.
A higher text-localization revenue share indicates a more concentrated service mix. It does not, by itself, demonstrate higher translation quality.
How did we build the ranking, and what is behind the market size? Read about the criteria and research methodology in 10 Most Experienced Localization Companies in 2025, and see the forecasts and market size in Game Text Localization Market 2025: Revenue Estimates and Key Trends.
Data, Methodology and Citation
Suggested citation
Allcorrect. Game Localization Companies: Ranking and Revenue Estimates. Dataset: Allcorrect research model, 47 providers, revenue reference year 2025. Accessed: (date of access). https://allcorrectgames.com/insights/gaming-localization-companies-ranking-and-revenue-estimates/
Short attribution: Source: Allcorrect's modeled 2025 game text localization revenue estimates.
Disclosure: These figures are model-based estimates unless explicitly identified as publicly reported data. Allcorrect publishes the study and is included in the dataset.
Corrections: Spotted an error or have newer public data? Send the company name, the affected figure, your source and the relevant reporting period.