
The game text localization market reached an estimated USD 246 million in 2025, but unlike the broader game outsourcing industry, text localization revenue is contracting. AI-driven price erosion is reducing cost per word faster than content volume can grow. This report ranks 47 companies by estimated 2025 game text localization revenue, explains the methodology behind the estimates, and explores why market concentration, MLV models, and service-mix differences create a significant gap between localization experience and commercial scale.
The game localization industry continues to grow, but text localization revenue tells a different story.
In this report, Allcorrect estimates the 2025 game text localization market at USD 246 million and ranks 47 companies by their likely share—from Keywords Studios at 40.5% down to boutique studios with under 0.1%. We explain the methodology, the four company archetypes, and why AI price erosion is compressing margins even as game content volumes rise.
Key findings:
- Top-three companies control ~60% of the market.
- Specialized studios earn 80%+ of revenue from text localization—full-service providers earn under 30%.
- Text localization peaked in 2024 and is now contracting—here’s why.
- MLV vs. SLV: Which model actually delivers better quality and margins?
In 2009, Allcorrect first received a request to provide multilingual localization for a mobile game into the standard EFIGS+CJK language set. At that time, we had one production office and no local partners in the countries whose languages the game had to be localized into. We therefore had to solve several tasks at once: find native-speaking freelancers, assess the quality of their translation, and work out how to pay them. We found solutions for all three tasks and have been working directly with linguists ever since, without subcontracting localization work to other companies.
Localization work usually follows an MLV-SLV chain, where the MLV (multiple-language vendor) acts as a general contractor (and possibly also translates into a handful of languages), and the SLVs (single-language vendors) perform the actual work. In addition, for many localization companies, text localization is an intermediate stage required for voice-over. During the voice-over process, text can change substantially because of timing, lip-syncing, line length, and other production constraints. As a result, the quality requirements for text prepared for dubbing may differ from the requirements for text that will go directly into the game.
Because Allcorrect has historically focused on text localization (as opposed to audio work), we decided to examine this segment in greater depth and assess the competitive landscape specifically within game text localization. The analysis uses data from our previous research. We limited the model to the companies included in that research: while many non-specialized companies may occasionally receive game localization jobs, we believe their share of the overall market is limited.
How Big Is the Game Text Localization Market in 2025?
Game text localization represents only a small part of the broader game outsourcing market, but it’s one of the segments most exposed to AI-driven price erosion. In our model, the 2025 game text localization market is fixed at USD 246 million.
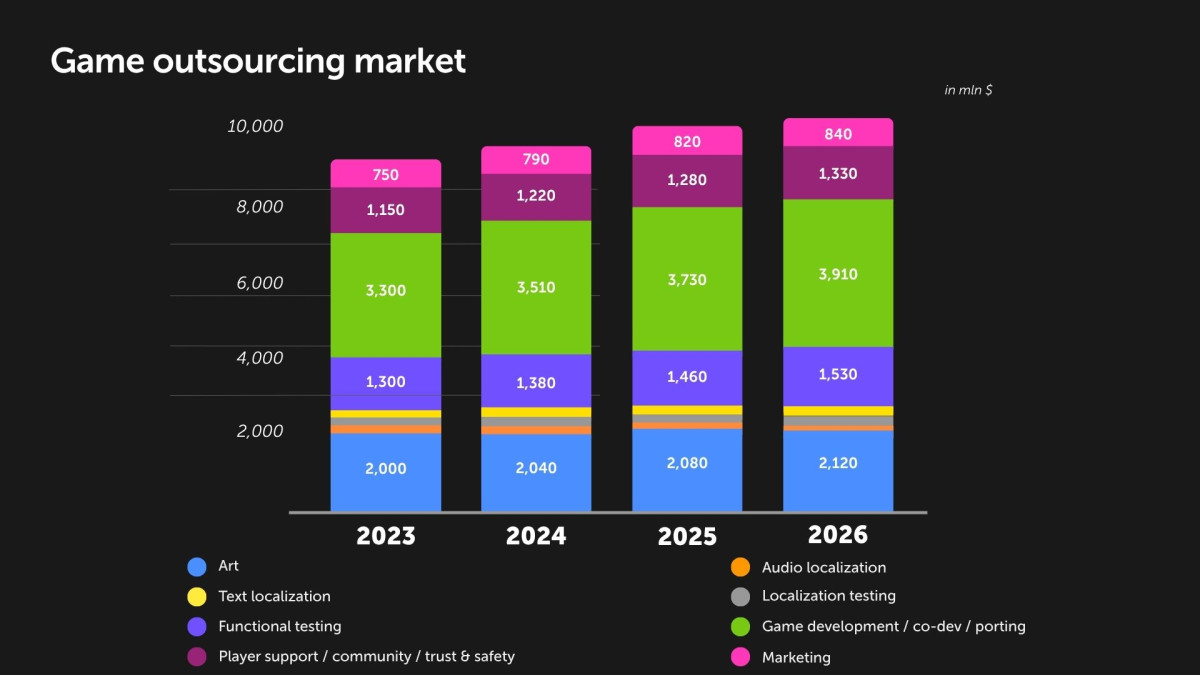
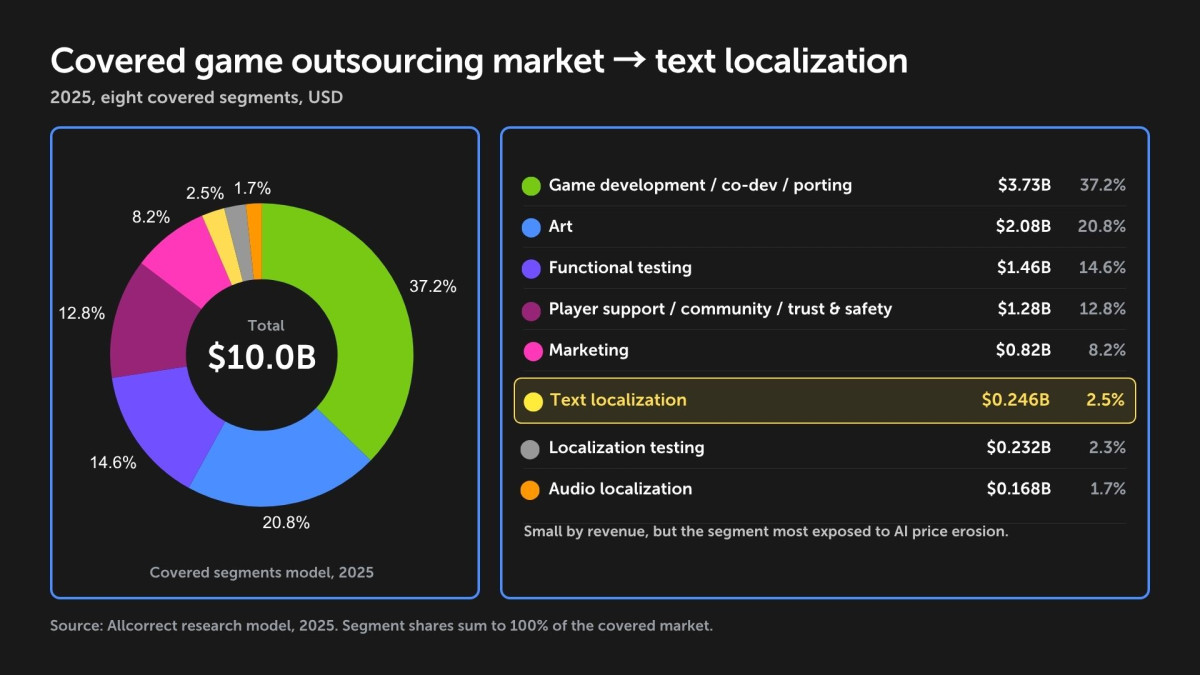
A market zoom-in from the covered game outsourcing market in 2025 on the game text localization segment. The figure shows that text localization accounts for roughly 2.5% of the covered outsourcing market, while also being one of the most exposed segments to AI price erosion.
Source model: covered game outsourcing segments, 2025. Figures in USD.
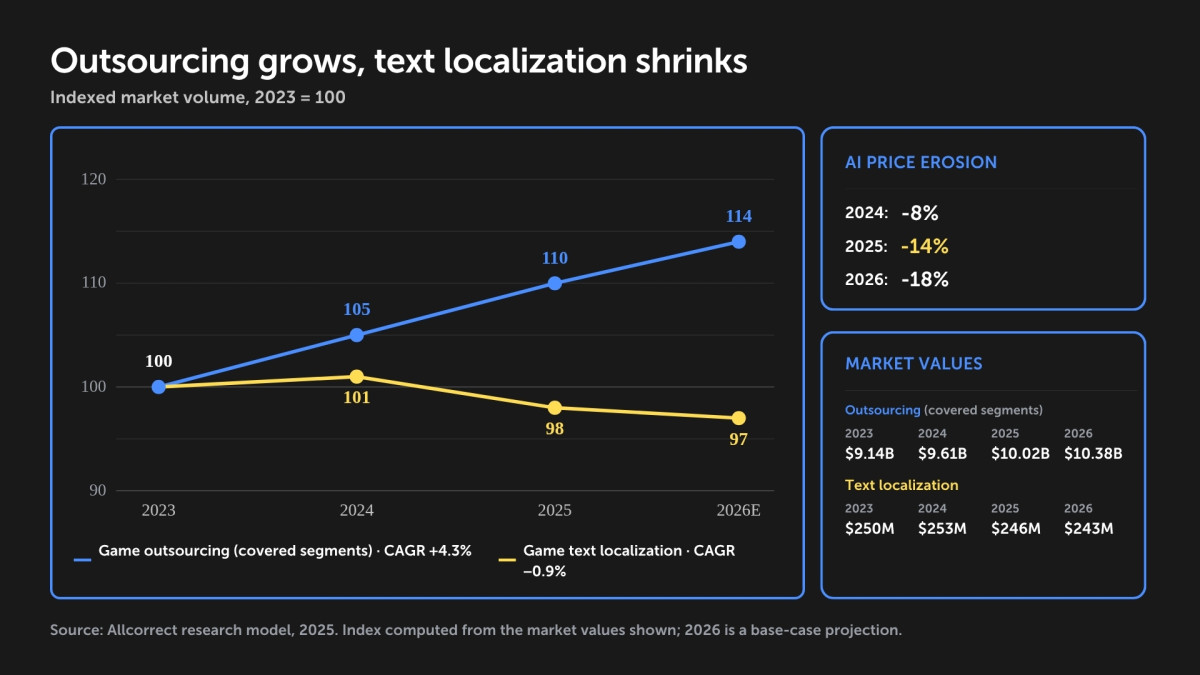
A two-line indexed chart comparing the overall covered game outsourcing market with the game text localization market from 2023 to 2026. The key message is that outsourcing continues to grow, while text localization peaks in 2024 and then contracts as AI reduces price per unit faster than content volume can grow.
Source: Allcorrect Research Model, 2025.
Game outsourcing keeps growing, but text localization revenue doesn’t move with it. AI is cutting the price per word faster than script volume can rise to compensate, so the segment can shrink in dollars even as demand for translated content keeps climbing.
Which Companies Lead the Game Localization Market in 2025?
The top-three companies account for approximately 60% of the 2025 game text localization market, and the top-10 account for approximately 77%. This suggests the segment is relatively concentrated and wouldn’t be easy for a new entrant to penetrate at scale.
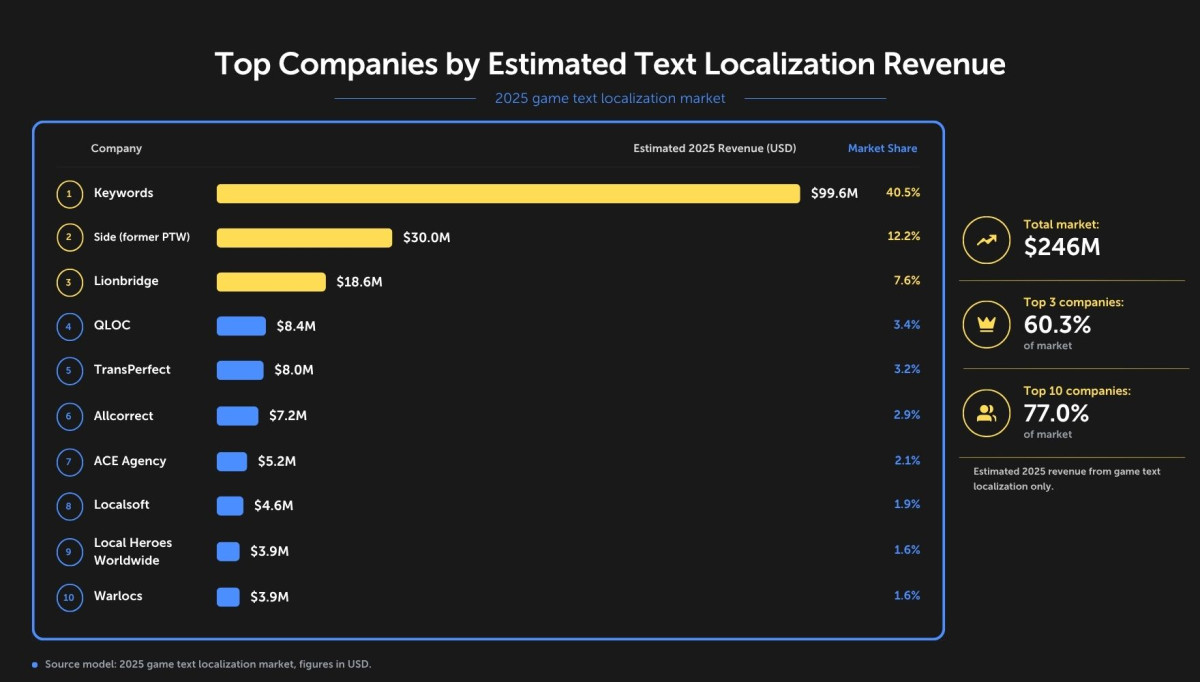 A horizontal bar chart ranking the top companies by estimated 2025 game text localization revenue. It highlights the USD 246 million total market, the top-three concentration, the top-10 concentration, and the long tail of smaller providers.
Does More Localization Experience Mean Higher Revenue?
It’s the question every studio comparing vendors eventually asks:
“If Company A has three times more localized titles than Company B, does that mean it earns three times more from text localization?”
Not necessarily. Company experience doesn’t always correlate linearly with revenue. MobyGames credits are an important sign of visibility and experience, but they don’t show project size, number of languages, word count, or the split between text localization and adjacent services. Large providers typically generate more revenue from text localization, but specialized studios can achieve meaningful revenue with fewer credits when their service mix is focused on text localization.
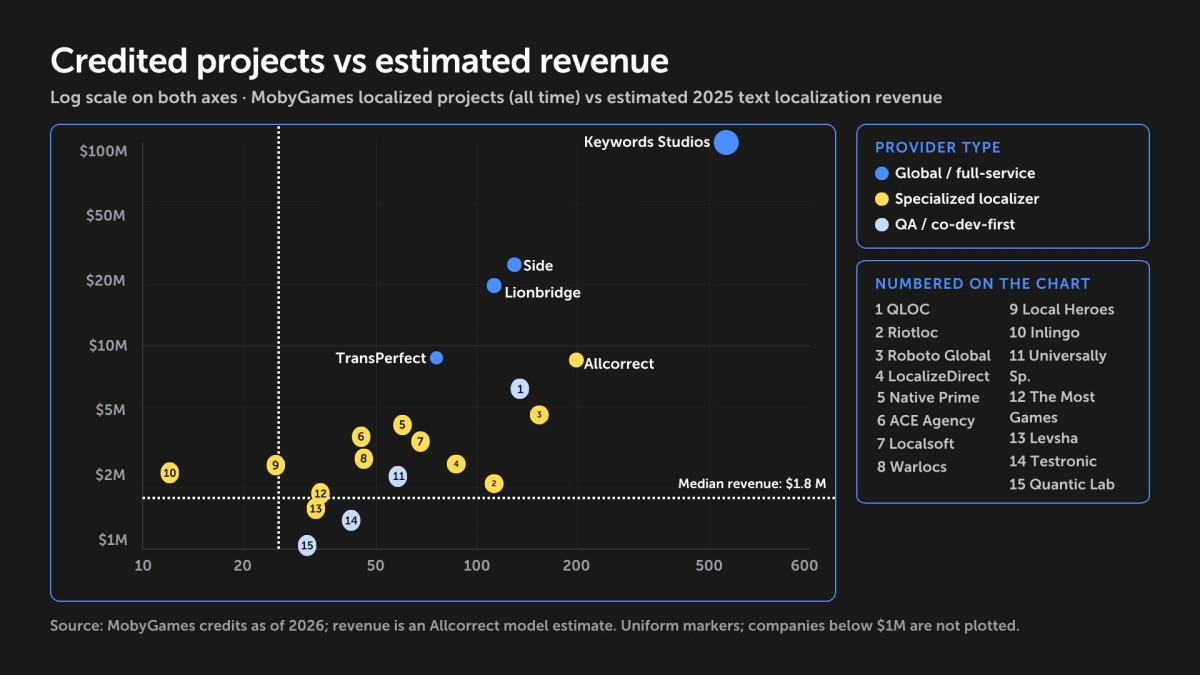
A scatter plot with MobyGames localized projects on the X-axis and estimated 2025 game text localization revenue on the Y-axis. Bubble size represents LinkedIn associated members, while color distinguishes global/full-service providers, specialized localizers, broad LSPs with a game vertical, and QA/co-dev-first companies. The figure demonstrates that experience matters but not linearly.
What Types of Companies Offer Game Localization Services?
Based on service mix and the degree of specialization in text localization, the companies in the study can be divided into four broad types: full-service game outsourcing platforms, global language service providers with a game vertical, specialized game localization studios, and QA/co-development-first companies with localization activity.
Specialized localization studios may generate more than 80% of their revenue from text localization, while for the other company types, the text localization share is usually below 30%. Specialized companies tend to be more focused on their core service, which may support stronger linguistic specialization and process depth in text localization.
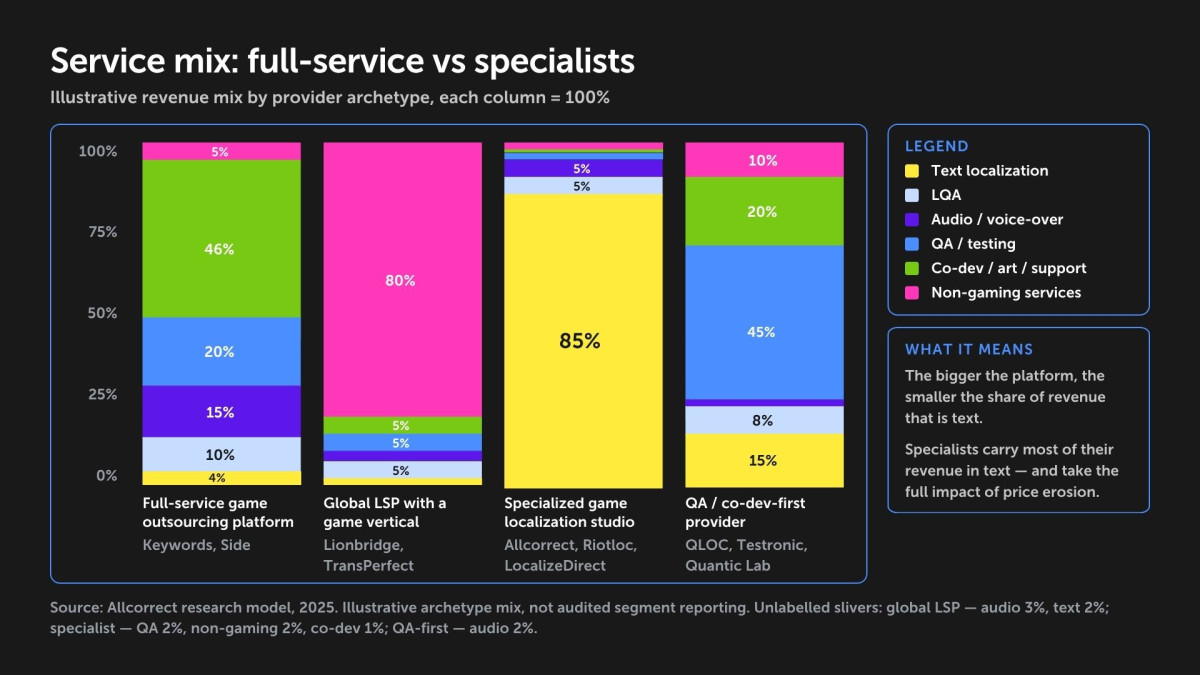 A 100% stacked-bar comparison of the revenue mix for four company archetypes. The figure explains why smaller specialized localizers often have a higher text localization share than large full-service providers: large providers also generate revenue from audio, LQA, QA, co-dev, art, support, and non-gaming services.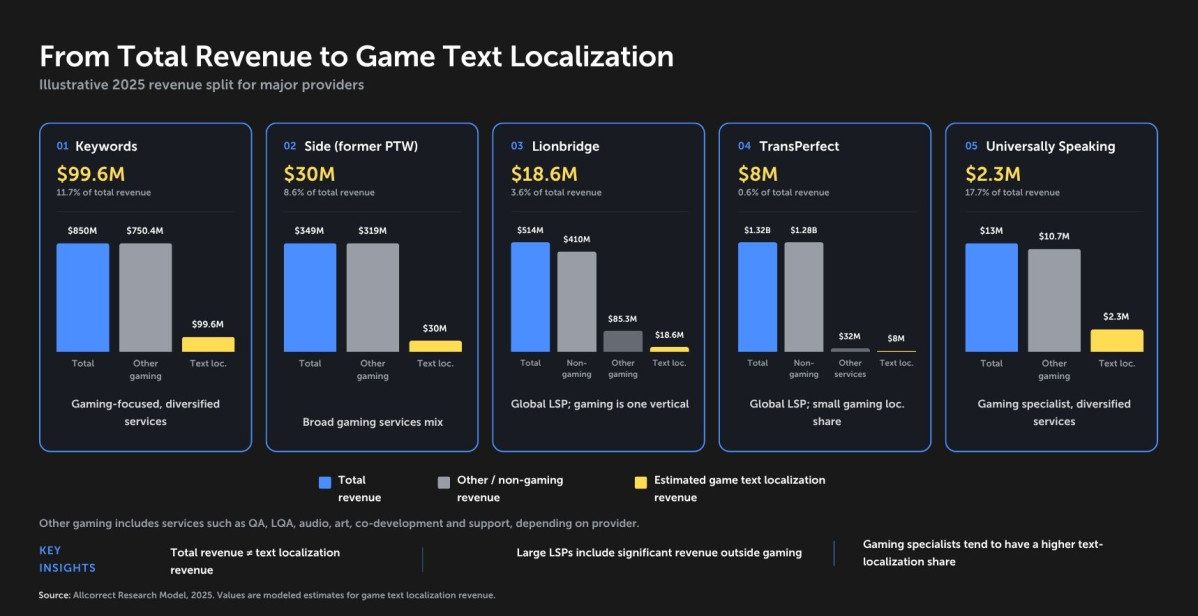
A waterfall view for selected major providers, showing how total company revenue is reduced by non-gaming services and non-text game services to arrive at the estimated game text localization revenue. This is especially important for Keywords, Side, Lionbridge, TransPerfect, and Universally Speaking.
The charts show a visible disproportion between the revenue of the largest companies and their accumulated localization experience. At first glance, the revenue per localized title appears to be much higher for the largest companies than for specialized localization providers. We do not yet have a definitive explanation for this phenomenon, but our working hypothesis is that the largest providers capture a significant share of MLV contracts and a significant share of the largest games by text volume. There may be several reasons for this:
- Some clients may purchase localization as one service within a broader package from a single global vendor in order to reduce vendor-management and quality-control costs.
- The largest vendors may offer a set of unique services that are important for the largest clients and therefore influence vendor selection. For example, they may be able to provide voice-over across a full language set, which isn’t part of the portfolio for most smaller companies.
- Some game localization projects, especially larger ones, may follow an MLV-SLV model, where a large vendor takes responsibility for all languages and then distributes the work across single-language vendors.
The open question we keep coming back to:
“Why do the largest vendors earn so much more per localized title than specialized studios with comparable MobyGames activity?”
We don’t yet have a definitive explanation. Testing the three hypotheses above is next on our research agenda.
The third point—the MLV-SLV model—deserves a separate comment. Localization has a highly developed freelance culture, so there is a possibility of handling MLV projects centrally, bypassing single-language companies. In this case, project management and QA are handled by the vendor’s in-house team, while linguists work remotely as freelance contractors. In this model, more of the budget reaches the workforce. Project management and quality control expertise accumulates within the vendor rather than being split between a general contractor and subcontractors. The supply chain is reduced, improving communications, accountability, response times for client requests, and price flexibility. This is how Allcorrect has been working since its first MLV contract in 2012.
In theory, the MLV-SLV model can reduce risk, increase supply chain scalability, and improve translation quality through SLV expertise. In practice, it often leads to diluted responsibility across the chain, while final translation quality may deteriorate because the information path from client to provider becomes longer and direct project involvement decreases. As for scalability, it still depends on the availability of the specific SLV and, ultimately, does not differ much from the scalability of a vendor that knows how to quickly recruit and manage freelancers.
Game Text Localization Revenue by Company (2025 Estimates)
The table below shows estimated 2025 game text localization revenue by company. All values are in USD millions unless stated otherwise. The estimates are normalized to the USD 246 million market anchor.
| # | Company | LinkedIn associated members |
Reported revenue, USD M |
Business profile | Text localization, USD M |
Text localization market share, 2025 |
Confidence |
|---|---|---|---|---|---|---|---|
| 1 | KeywordsiSource: Nimdzi 2026 preliminary ranking, 2025 revenue | 11,846 | 850 | Global game-services provider; full-service stack | 99.6 | 40.5% | High |
| 2 | Side (formerly PTW)iSource: Nimdzi 2026 preliminary ranking, 2025 revenue | 3,096 | 349 | Global game-services provider; Side/PTW full-service stack | 30 | 12.2% | High |
| 3 | LionbridgeiSource: Nimdzi 2026 preliminary ranking, 2025 revenue | 1,269 | 513.9 | Diversified LSP; games are non-core | 18.6 | 7.6% | Medium |
| 4 | QLOCiSource: No public revenue in workbook; activity score estimate | 500 | — | Game services: porting/co-dev/QA/localization | 8.4 | 3.4% | Low |
| 5 | TransPerfectiSource: Nimdzi 2026 preliminary ranking, 2025 revenue | 130 | 1,320 | Diversified LSP; games are non-core | 8 | 3.2% | Medium |
| 6 | AllcorrectiSource: Allcorrect data: actual 2025 game text localization revenue | 358 | 8.1 | Game-specialist localization provider | 7.2 | 2.9% | High |
| 7 | ACE AgencyiSource: No public revenue in workbook; activity score estimate | — | — | Game localization/boutique | 5.2 | 2.1% | Low |
| 8 | LocalsoftiSource: No public revenue in workbook; activity score estimate | 149 | — | Game localization/boutique | 4.6 | 1.9% | Low |
| 9 | Local Heroes WorldwideiSource: No public revenue in workbook; activity score estimate | 23 | — | Game localization/boutique | 3.9 | 1.6% | Low |
| 10 | WarlocsiSource: No public revenue in workbook; activity score estimate | 26 | — | Game localization/boutique | 3.9 | 1.6% | Low |
| 11 | Altagram GroupiSource: No public revenue in workbook; activity score estimate | 207 | — | Game localization/boutique | 3.5 | 1.4% | Low |
| 12 | Roboto GlobaliSource: Rejestr/BizRaport: 2025 revenue PLN 16.9M; converted using ECB average 2025 USD/PLN | 148 | 4.5 | Game localization provider with multilingual/audio/LQA services | 3.4 | 1.4% | High |
| 13 | 4-Real IntermediaiSource: No public revenue in workbook; activity score estimate | 11 | — | Game localization/boutique | 3.2 | 1.3% | Low |
| 14 | InlingoiSource: Slator Index: 2024 revenue; adjusted to 2025 by text localization market trend (−2.8%) | 22 | 3.9 | Game localization/boutique | 3.2 | 1.3% | Medium |
| 15 | GameLoc Localisation ServicesiSource: No public revenue in workbook; activity score estimate | 16 | — | Game localization/boutique | 3 | 1.2% | Low |
| 16 | GameScribesiSource: No public revenue in workbook; activity score estimate | 60 | — | Game localization/boutique | 2.8 | 1.2% | Low |
| 17 | LocadileiSource: No public revenue in workbook; activity score estimate | 55 | — | Game localization/boutique | 2.7 | 1.1% | Low |
| 18 | Universally SpeakingiSource: Companies House: full accounts filed to March 31, 2025; model uses service-mix allocation from accounts/services | 469 | 13 | Game services; localization is part of broader service mix | 2.3 | 1.0% | Medium |
| 19 | LocalizeDirecti Site Source: Allabolag: 2024 turnover kSEK 27,129; adjusted to 2025 by text localization trend | 97 | 2.8 | Game localization provider | 2.3 | 0.9% | Medium |
| 20 | Logrus ITiSource: Slator Index: 2025 revenue | 94 | 7.6 | Diversified localization/software LSP with game activity | 2.1 | 0.9% | Medium |
| 21 | RiotlociSource: Rekvizitai.lt: 2024 sales revenue EUR 1.98M; adjusted to 2025 by text localization trend | 45 | 2.2 | Game localization provider | 2 | 0.8% | Medium |
| 22 | The Most GamesiSource: Rekvizitai.lt: TMG Technologies 2025 sales revenue EUR 1.9M; converted using 2025 average EUR/USD | 62 | 2.2 | Game localization provider | 1.9 | 0.8% | Medium |
| 23 | Locpick Game Localization & AudioiSource: No public revenue in workbook; activity score estimate | — | — | Audio/localization provider | 1.9 | 0.8% | Low |
| 24 | Studio UmlautiSource: No public revenue in workbook; activity score estimate | 130 | — | Game localization/boutique | 1.8 | 0.7% | Low |
| 25 | Level UpiSource: No public revenue in workbook; activity score estimate | 8 | — | Game localization/boutique | 1.6 | 0.7% | Low |
| 26 | Native PrimeiSource: French registry/Pappers: 2024 revenue EUR 1.72M; adjusted to 2025 by text localization trend | 64 | 1.9 | Game localization provider | 1.6 | 0.7% | Medium |
| 27 | Quoted Tradução e LocalizaçãoiSource: No public revenue in workbook; activity score estimate | 30 | — | Game localization/boutique | 1.6 | 0.6% | Low |
| 28 | Aibell Game LocalizationiSource: No public revenue in workbook; activity score estimate | 21 | — | Game localization/boutique | 1.5 | 0.6% | Low |
| 29 | Levsha GamesiSource: Inforegister/e-Äriregister: Scaevola OÜ 2024 revenue EUR 1.54M; adjusted to 2025 by text localization trend | 60 | 1.7 | Game localization provider | 1.5 | 0.6% | Medium |
| 30 | Loki GamesiSource: No public revenue in workbook; activity score estimate | — | — | Game localization/boutique | 1.4 | 0.6% | Low |
| 31 | Effective MediaiSource: No public revenue in workbook; activity score estimate | — | — | Specialist, likely one/few-language game localization | 1.3 | 0.5% | Low |
| 32 | Testronic LabsiSource: Companies House: 2024 accounts filed; 2024 revenue from the source table adjusted by core outsourcing growth | 1 | 26.6 | QA/game services; text localization is secondary | 1.1 | 0.5% | Medium |
| 33 | DICO CoiSource: No public revenue in workbook; activity score estimate | 48 | — | Game localization/boutique | 1.1 | 0.4% | Low |
| 34 | Kinsha Co., Ltd.iSource: No public revenue in workbook; activity score estimate | 57 | — | Game localization/boutique | 1 | 0.4% | Low |
| 35 | Quantic LabiSource: Termene.ro: 2025 turnover RON 49.7M; converted using ECB/Bundesbank 2025 average | 338 | 11.1 | QA/game services; text localization is secondary | 0.9 | 0.4% | Medium |
| 36 | Latis Global CommunicationsiSource: Slator Index: 2025 revenue | 94 | 5.9 | Diversified LSP; games are non-core | 0.9 | 0.4% | Medium |
| 37 | EC Innovations InciSource: Nimdzi 2026 preliminary ranking, 2025 revenue | 718 | 53 | Diversified LSP; games are non-core | 0.8 | 0.3% | Medium |
| 38 | Pink NoiseiSource: No public revenue in workbook; activity score estimate | 211 | — | Audio/localization provider | 0.7 | 0.3% | Low |
| 39 | Intac Co., Ltd.iSource: No public revenue in workbook; activity score estimate | — | — | Game localization/boutique | 0.6 | 0.2% | Low |
| 40 | GlobalWayiSource: No public revenue in workbook; activity score estimate | — | — | Game localization/boutique | 0.6 | 0.2% | Low |
| 41 | GlobaLociSource: No public revenue in workbook; activity score estimate | 4 | — | Game localization/boutique | 0.6 | 0.2% | Low |
| 42 | Wiitrans NetworkiSource: No public revenue in workbook; activity score estimate | 198 | — | Diversified LSP; games are non-core | 0.4 | 0.2% | Low |
| 43 | RoundTable StudioiSource: No public revenue in workbook; activity score estimate | 67 | — | Game localization/boutique | 0.4 | 0.2% | Low |
| 44 | Alpha CRCiSource: Nimdzi 2026 preliminary ranking, 2025 revenue | 3,976 | 31.1 | Diversified LSP; games are non-core | 0.3 | 0.1% | Medium |
| 45 | Loc’d and LoadediSource: No public revenue in workbook; activity score estimate | 1,352 | — | Game localization/boutique | 0.2 | 0.1% | Low |
| 46 | S&H Entertainment LocalizationiSource: No public revenue in workbook; activity score estimate | 6 | — | Game localization/boutique | 0.1 | 0.0% | Low |
| 47 | DLM InternationaliSource: No public revenue in workbook; activity score estimate | 77 | — | Game localization/boutique | 0.1 | 0.0% | Low |
Methodology: Estimating 2025 Game Text Localization Revenue by Company
This model estimates company-level revenue from game text localization in 2025.
The model does not estimate total company revenue, total game outsourcing revenue, or the full localization stack.
It focuses only on the text localization of games. The following service categories are excluded from the estimate:
- voice-over and dubbing;
- audio production;
- localization QA;
- functional QA;
- co-development and porting;
- art production;
- player support;
- marketing services;
- non-gaming translation and localization.
The total addressable market used in the model is USD 246 million for game text localization in 2025. This figure is used as the market anchor: the sum of all company-level estimates is normalized to match the total market size.
Why a model is needed
Most companies in the ranking do not publicly disclose revenue specifically from game text localization. Even when total revenue is available, it usually covers a much broader business. Large full-service game service providers may generate revenue from QA, audio, art, co-development, player support, and other outsourcing lines. Broad language service providers may generate most of their revenue from non-gaming verticals such as life sciences, legal, technology, corporate translation, interpretation, and media localization.
As a result, public revenue cannot be used directly as game text localization revenue. The model therefore estimates each company’s likely share of the 2025 game text localization market by combining market size, localization activity, business profile, public or registry-based revenue data, LinkedIn-based operating scale, and service-mix assumptions.
Core model structure
The model is a closed market allocation model.
It works in six steps:
The total 2025 game text localization market is fixed at USD 246 million.
Companies with known or strongly supported text localization revenue are assigned fixed estimates.
Companies with public total revenue are constrained by plausible text localization shares.
The remaining market is distributed among other companies based on adjusted activity scores.
LinkedIn associated members are used as a soft operating-scale modifier.
Final estimates are normalized so that the total equals the market size.
This prevents the combined company estimates from exceeding the total addressable market.
Activity score
The activity score is based on two MobyGames-derived indicators:
- total number of localized game projects;
- average number of localized projects per year between 2023 and 2025.
The weighting is:
- 70% current activity: Average localized projects per year between 2023 and 2025;
- 30% accumulated experience: Total localized projects.
This weighting gives more importance to current market presence than to historical portfolio size. A company with many older credits but lower recent activity receives a lower estimate than a company with strong current activity.
Business profile adjustment
MobyGames credits show project participation but do not reveal the commercial size of each project. One credit may represent one language, a small indie title, a large AAA release, or a full multilingual localization package.
To account for this, the model applies business profile coefficients.
Higher coefficients are assigned to companies that are more likely to generate revenue primarily from game text localization, particularly specialized game localization studios and multilingual localization providers.
Lower coefficients are assigned to companies where game text localization is only one part of a broader service mix, such as:
- broad language service providers;
- QA-first companies;
- co-development or porting-first companies;
- audio-first or full-service outsourcing providers.
This adjustment is necessary because equal MobyGames activity does not necessarily imply equal text localization revenue.
Localization service-mix adjustment
The model also accounts for differences in service mix within the localization segment itself. For large full-service providers such as Keywords Studios, Side, Lionbridge, and TransPerfect, localization revenue is usually not limited to text translation. Their localization-related business may include text localization, localization QA, voice-over, dubbing, audio production, casting, recording, and multilingual production management.
In particular, large providers often operate or coordinate audio recording capabilities across multiple countries and languages. As a result, even when a large company is highly active in game localization, only part of its localization-related revenue should be attributed to text localization.
Smaller specialized localization companies often have a narrower service mix. Many of them focus primarily on text localization and linguistic project management, and do not operate their own voice-over studios across multiple countries. When they provide audio-related services, these are often handled through external partners or represent a smaller share of the business.
For this reason, the model assigns a higher text localization share to smaller specialized localization providers than to large full-service companies. This doesn’t mean smaller companies are larger in absolute terms. It means that a higher proportion of their relevant gaming revenue is likely to come from text localization, while larger companies distribute their localization revenue across a broader set of services, including audio and localization testing.
A big vendor with the same number of game credits as a boutique studio usually earns less from text specifically — because its localization revenue is split across audio, dubbing, and QA too, not because it does less text work.
Specialist localization adjustment
Specialized game localization companies receive a higher text localization share than broad full-service providers. This reflects the fact that, for text-first localization studios, a larger part of total revenue is likely to come from text localization rather than from QA, audio, art, co-development, or player support.
For highly specialized localization companies, the model assumes text localization can represent the majority of gaming-related revenue. For Riotloc, the model assumes almost all relevant revenue is generated from text localization.
For specialized localization providers without public revenue data, the model increases the adjusted activity score to reflect their stronger dependence on text localization as a core business line.
Public and registry financial data
Where available, the model uses public financial data from company registries, annual accounts, industry rankings, and verified company filings as an additional constraint.
These sources include public company registries and financial databases in the relevant jurisdictions, such as the UK Companies House, French corporate data, Romanian company data, Lithuanian company data, Estonian registry data, Swedish corporate data, Polish registry data, and industry datasets such as the Slator Index and Nimdzi rankings.
This data isn’t treated as direct game text localization revenue unless the company-specific context supports that interpretation. Instead, total revenue is used as an upper bound or calibration point.
For companies with public total revenue, the model estimates the share that can reasonably be attributed to game text localization based on the following:
- business profile;
- gaming vs. non-gaming exposure;
- service mix;
- specialization level;
- known or likely role of text localization in the company’s revenue;
- MobyGames activity;
- LinkedIn operating scale.
Revenue constraints
Where public or reliable revenue data is available, the model uses it as an upper bound or calibration point. For diversified companies such as Keywords Studios, Side, Lionbridge, TransPerfect, Alpha CRC, Latis, EC Innovations, and similar broad LSPs or multi-service providers, only a limited portion of total revenue is attributed to game text localization.
This reflects their broader service portfolios and, in several cases, substantial non-gaming revenue.
For Allcorrect, the model uses a fixed value of USD 7,221,485.79 for 2025 game text localization revenue.
For companies with known total revenue but broader service portfolios, the model applies a cap based on the estimated share of revenue that can plausibly come from game text localization.
For companies without public revenue data, the estimate is based on adjusted MobyGames activity, business profile coefficient, specialist localization adjustment, and LinkedIn operating-scale modifier.
Treatment of 2024 revenue data
Some company revenue data is available only for 2024. In those cases, the model adjusts it to 2025 before applying the relevant text localization share.
For companies primarily exposed to game text localization, the adjustment follows the modeled change in the game text localization market:
- 2024 game text localization market: USD 253 million;
- 2025 game text localization market: USD 246 million.
This implies a 2024–2025 adjustment factor of:
246 / 253 = 0.972
The adjusted 2025 revenue is then multiplied by the estimated share attributable to game text localization.
For companies whose business is primarily QA, testing, or broader game services, the 2024 revenue may instead be adjusted using the modeled change in the broader game outsourcing market, depending on the company’s service profile.
Currency conversion
All non-USD revenue figures are converted into USD using average annual exchange rates for 2025.
If only 2024 revenue is available, the model first adjusts the figure to a 2025-equivalent revenue level and then converts it into USD using the 2025 average exchange rate.
This creates a single comparable USD-denominated dataset across companies reporting in EUR, GBP, SEK, RON, PLN, and other local currencies.
LinkedIn operating-scale modifier
The model also uses LinkedIn associated members as an additional operating-scale sign.
LinkedIn headcount is not treated as a direct revenue proxy. It’s a noisy metric: associated members may include sales, HR, finance, QA, audio, art, co-development teams, non-gaming divisions, former employees, freelancers, or people attached to a parent company rather than a game localization unit.
For that reason, LinkedIn is used only as a soft capacity modifier, not as a primary driver of revenue allocation.
The model converts LinkedIn associated members into a capped scale score:
- unknown: 0.5
- 1–20 members: 0.3
- 21–50 members: 0.5
- 51–150 members: 0.7
- 151–500 members: 0.9
- 500+ members: 1.0
The LinkedIn multiplier is calculated as:
0.90 + 0.20 × LinkedIn scale score
This keeps the effect limited. LinkedIn can moderately increase or decrease a company’s adjusted activity score, but it cannot dominate the model or allow very large diversified companies to take disproportionate market share solely because of corporate headcount.
Normalization
After applying fixed values, revenue caps, business profile adjustments, specialist adjustments, registry-based constraints, currency conversion, and LinkedIn modifiers, the remaining market is distributed among the rest of the companies.
The final estimates are normalized so that the total company-level revenue equals the total 2025 game text localization market of USD 246 million.
This means that increasing the estimate for one company reduces the available market share for others. The model therefore reflects competitive allocation within a fixed market size.
Confidence levels
Each company estimate is assigned a confidence level. Confidence evaluates the reliability of the estimate, not the quality of the company.
| Confidence | Definition | Examples |
|---|---|---|
| High | The estimate is based on strong company-specific evidence, a known text localization revenue figure, or a highly relevant business profile. | Allcorrect, Keywords, Side, Roboto Global |
| Medium | Public total revenue is available, but the game text localization share must be modeled. | Lionbridge, TransPerfect, Inlingo, Universally Speaking, LocalizeDirect, Riotloc |
| Low | The estimate depends mainly on MobyGames activity, LinkedIn scale, and analytical assumptions as no public revenue data is available. | QLOC, ACE Agency, Localsoft, Local Heroes Worldwide, Warlocs |
Example confidence matrix
| Company | Est. text localization revenue 2025 |
Market share | Confidence | Why this confidence |
|---|---|---|---|---|
| Keywords | $99.63M | 40.5% | High | Public group revenue is available; the company is a gaming-first full-service provider; text localization is separated through a cap and service-mix model. |
| Side (formerly PTW) | $29.97M | 12.2% | High | Public revenue is available; Side/PTW is a large game-services provider; text localization is constrained within the full-service mix. |
| Lionbridge | $18.62M | 7.6% | Medium | Public revenue is available, but games are only one vertical; the game text localization share is modeled. |
| QLOC | $8.39M | 3.4% | Low | Strong game activity, but insufficient public revenue data for direct text localization calculation. |
| TransPerfect | $7.99M | 3.2% | Medium | Public revenue is available, but the company is a broad LSP; games and text localization represent a small share. |
| Allcorrect | $7.22M | 2.9% | High | Actual 2025 game text localization revenue is used. |
| ACE Agency | $5.23M | 2.1% | Low | The estimate is based on activity, business profile, LinkedIn scale, and available public data. |
| Localsoft | $4.64M | 1.9% | Low | The estimate is based on activity, business profile, LinkedIn scale, and available public data. |
| Local Heroes Worldwide | $3.89M | 1.6% | Low | The estimate is based on activity, business profile, LinkedIn scale, and available public data. |
| Warlocs | $3.89M | 1.6% | Low | The estimate is based on activity, business profile, LinkedIn scale, and available public data. |
Key limitation
The model should not be interpreted as audited financial reporting. It is a market reconstruction.
MobyGames data is useful for measuring experience and visibility in game localization credits, but it does not show:
- the number of languages per project;
- word count;
- project value;
- whether the work covered full text localization or only partial language support;
- whether the company handled related services such as LQA or audio;
- the exact split between gaming and non-gaming revenue.
LinkedIn associated members add an operating-scale sign, but they also have limitations. They don’t show how many people work specifically on game text localization, and they may include employees from unrelated departments or business units.
Public registry revenue improves the model, but total revenue still has to be interpreted through each company’s service mix. A broad LSP or full-service outsourcing provider may have much higher total revenue than a specialized game localization studio, while having a lower percentage of revenue attributable specifically to text localization.
Therefore, the model combines several signs rather than relying on a single data source.
Interpretation
The resulting estimate should be read as the most plausible allocation of the 2025 game text localization market across visible localization providers.
A high estimate indicates a combination of:
- strong recent activity;
- large accumulated experience;
- probable multilingual delivery;
- specialization in game localization;
- sufficient operating scale;
- consistency with available revenue constraints.
A lower estimate doesn’t necessarily mean lower quality or weaker expertise. It may reflect narrower language coverage, smaller project scale, lower recent activity, a broader non-text service mix, limited operating scale, or limited public revenue visibility.
Read the ranking as a map of the market, not a scorecard of quality. A company at #35 isn’t a worse localization partner than #5 — it may simply run a narrower language set or a leaner, more focused business.
FAQ
The game text localization market is estimated at USD 246 million in 2025. This represents approximately 2.5% of the broader game outsourcing market. Unlike overall game outsourcing, which continues to grow, text localization revenue is contracting as AI-driven price erosion reduces cost per word faster than content volume expands.
Keywords Studios leads the market with an estimated USD 99.6 million in game text localization revenue in 2025, representing approximately 40.5% of the total market. Side (formerly PTW) is second with approximately USD 30 million (12.2%), and Lionbridge is third with approximately USD 18.6 million (7.6%). The top-three companies together account for approximately 60% of the market.
An MLV (multiple-language vendor) acts as a general contractor, taking responsibility for delivering localization across all required languages. An SLV (single-language vendor) performs the actual translation into one specific language. In the MLV-SLV chain, the MLV manages the project and distributes work to SLVs. Some studios, including Allcorrect, handle MLV projects by working directly with freelance linguists rather than subcontracting to other companies.
AI-driven price erosion is the primary cause. The cost per word for translation is falling faster than game content volume is increasing. As a result, the game text localization segment peaked in 2024 (estimated at USD 253 million) and contracted to USD 246 million in 2025, even as the broader game outsourcing market continued to expand.
Based on service mix and specialization, game localization providers can be divided into (1) full-service game outsourcing platforms, (2) global language service providers with a game vertical, (3) specialized game localization studios, and (4) QA/co-development-first companies with localization activity. Specialized studios may generate more than 80% of their revenue from text localization, while for the other types the share is typically below 30%.
Each estimate is assigned a confidence level: High, Medium, or Low. High-confidence estimates are based on actual revenue data or strong company-specific evidence (e.g., Allcorrect, Keywords Studios, Side). Medium-confidence estimates use public total revenue adjusted for service mix. Low-confidence estimates rely primarily on MobyGames activity scores, LinkedIn scale, and analytical assumptions as no public revenue data is available.


