In 2016, the dominance of the gaming industry’s mobile segment became apparent. Since then, we have published the ratings of the most promising markets for mobile games developers.
This year, we’ve added a language rating to the country rating since this is a particularly important parameter for developers to consider when localizing games.
| № | Country | Users | ARPU, USD | Revenue, USD | CPI, USD | Marginal profit, USD |
|---|---|---|---|---|---|---|
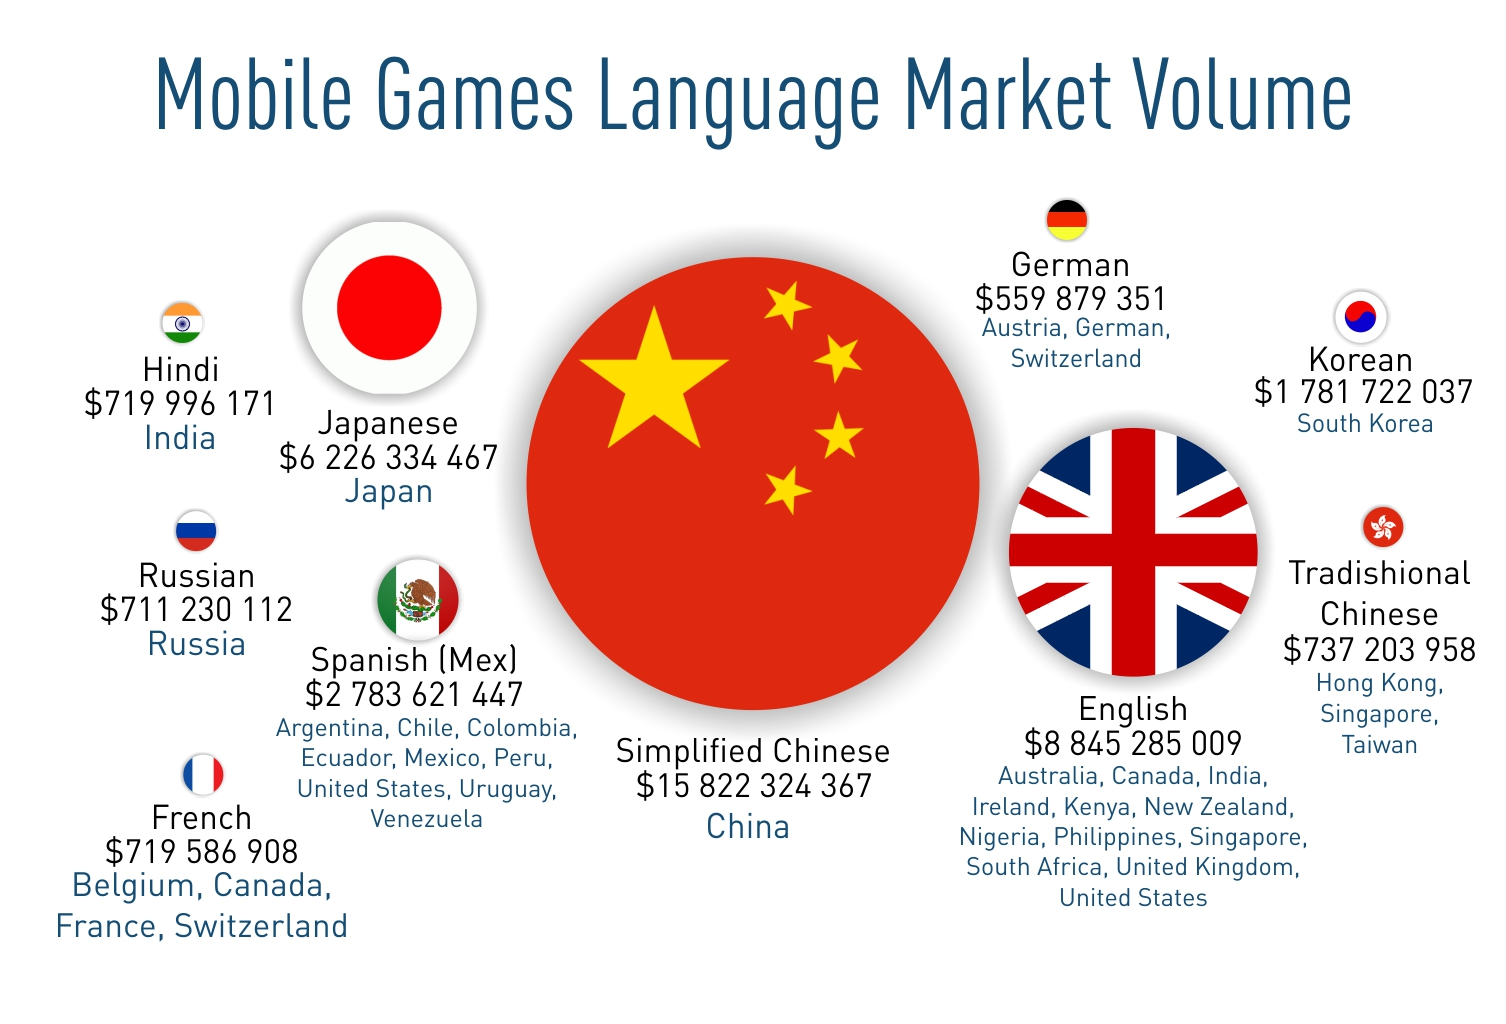
| 1 | China | 422 250 000 | 36,32 | 16 252 900 000 | 1,02 | 15 822 324 367 |
| 2 | United States | 173 060 000 | 54,97 | 9 513 800 000 | 1,80 | 9 202 936 021 |
| 3 | Japan | 46 880 000 | 134,83 | 6 320 200 000 | 2,00 | 6 226 334 467 |
| 4 | South Korea | 18 000 000 | 99,54 | 1 791 200 000 | 0,53 | 1 781 722 037 |
| 5 | United Kingdom | 17 000 000 | 74,34 | 1 263 900 000 | 1,18 | 1 243 848 043 |
| 6 | India | 121 610 000 | 6,75 | 821 100 000 | 0,05 | 814 642 131 |
| 7 | Russia | 26 130 000 | 27,39 | 715 900 000 | 0,18 | 711 230 112 |
| 8 | Mexico | 34 380 000 | 20,46 | 703 300 000 | 0,11 | 699 363 943 |
| 9 | Taiwan | 12 000 000 | 58,33 | 700 000 000 | 0,83 | 690 025 227 |
| 10 | Nigeria | 61 140 000 | 9,94 | 607 600 000 | 0,17 | 597 206 200 |
| 11 | France | 16 510 000 | 36,05 | 595 300 000 | 0,55 | 586 250 454 |
| 12 | Indonesia | 64 030 000 | 8,91 | 570 500 000 | 0,13 | 562 348 134 |
| 13 | Germany | 16 280 000 | 31,84 | 518 200 000 | 0,63 | 507 877 808 |
| 14 | Colombia | 18 100 000 | 23,17 | 419 300 000 | 0,10 | 417 460 512 |
| 15 | Italy | 13 910 000 | 29,92 | 416 300 000 | 0,26 | 412 678 305 |
| 16 | Canada | 12 600 000 | 29,96 | 377 400 000 | 1,11 | 363 361 514 |
| 17 | Brazil | 55 480 000 | 5,96 | 330 900 000 | 0,10 | 325 626 195 |
| 18 | Iran | 23 490 000 | 13,12 | 308 300 000 | 0,23 | 302 944 626 |
| 19 | Spain | 9 150 000 | 32,72 | 299 400 000 | 0,34 | 296 326 841 |
| 20 | Egypt | 20 960 000 | 13,16 | 275 700 000 | 0,12 | 273 266 854 |
| 21 | Argentina | 8 580 000 | 23,20 | 199 000 000 | 0,12 | 197 967 402 |
| 22 | Netherlands | 3 550 000 | 44,71 | 158 500 000 | 0,58 | 156 428 647 |
| 23 | Peru | 6 960 000 | 20,29 | 141 300 000 | 0,15 | 140 271 471 |
| 24 | Saudi Arabia | 3 660 000 | 37,89 | 138 600 000 | 0,18 | 137 939 966 |
| 25 | Turkey | 11 020 000 | 11,71 | 129 100 000 | 0,09 | 128 124 877 |
| 26 | Poland | 4 700 000 | 27,33 | 128 400 000 | 0,21 | 127 392 203 |
| 27 | United Arab Emirates | 2 700 000 | 47,32 | 127 800 000 | 0,26 | 127 098 303 |
| 28 | Australia | 6 320 000 | 20,34 | 128 700 000 | 1,24 | 120 834 127 |
| 29 | Sweden | 2 290 000 | 50,54 | 115 600 000 | 0,75 | 113 885 025 |
| 30 | Belgium | 3 840 000 | 25,57 | 98 300 000 | 0,50 | 96 379 258 |
| 31 | Thailand | 3 250 000 | 26,45 | 86 100 000 | 0,15 | 85 624 172 |
| 32 | Pakistan | 14 760 000 | 5,79 | 85 500 000 | 0,08 | 84 364 711 |
| 33 | Norway | 1 230 000 | 64,29 | 79 400 000 | 0,94 | 78 248 159 |
| 34 | Chile | 4 200 000 | 17,89 | 75 200 000 | 0,14 | 74 603 362 |
| 35 | New Zealand | 1 350 000 | 53,02 | 71 600 000 | 1,11 | 70 102 752 |
| 36 | Philippines | 3 770 000 | 17,88 | 67 500 000 | 0,15 | 66 949 685 |
| 37 | Denmark | 750 000 | 73,39 | 54 700 000 | 0,82 | 54 086 088 |
| 38 | Malaysia | 4 000 000 | 13,58 | 54 300 000 | 0,26 | 53 263 812 |
| 39 | Austria | 1 360 000 | 37,71 | 51 400 000 | 0,80 | 50 313 544 |
| 40 | Ireland | 1 820 000 | 28,07 | 51 000 000 | 0,48 | 50 124 970 |
| 41 | Israel | 1 020 000 | 48,66 | 49 800 000 | 0,31 | 49 482 677 |
| 42 | Vietnam | 3 580 000 | 12,72 | 45 500 000 | 0,15 | 44 966 037 |
| 43 | Switzerland | 1 850 000 | 25,18 | 46 500 000 | 1,18 | 44 312 164 |
| 44 | Finland | 960 000 | 46,54 | 44 700 000 | 0,60 | 44 121 485 |
| 45 | Singapore | 860 000 | 48,77 | 41 800 000 | 0,63 | 41 262 349 |
| 46 | Ecuador | 5 890 000 | 7,07 | 41 600 000 | 0,13 | 40 829 722 |
| 47 | Hong Kong | 1 650 000 | 25,48 | 41 900 000 | 0,90 | 40 411 381 |
| 48 | Sri Lanka | 3 670 000 | 10,67 | 39 200 000 | 0,10 | 38 826 354 |
| 49 | South Africa | 9 960 000 | 4,13 | 41 100 000 | 0,50 | 36 085 790 |
| 50 | Czech Republic | 1 510 000 | 22,69 | 34 300 000 | 0,29 | 33 856 145 |
| 51 | Uruguay | 1 320 000 | 25,21 | 33 300 000 | 0,19 | 33 043 536 |
| 52 | Portugal | 1 140 000 | 24,97 | 28 600 000 | 0,21 | 28 355 245 |
| 53 | Venezuela | 5 060 000 | 5,63 | 28 500 000 | 0,12 | 27 867 597 |
| 54 | Kenya | 4 510 000 | 6,12 | 27 600 000 | 0,11 | 27 100 315 |
| 55 | Romania | 1 700 000 | 13,68 | 23 200 000 | 0,13 | 22 986 142 |
| 56 | Hungary | 1 270 000 | 13,78 | 17 500 000 | 0,17 | 17 287 905 |
METHODOLOGY FOR COMPILING A RATING ON THE PROFITABILITY OF MOBILE GAMES MARKETS:
- Countries and languages are placed in descending order of their relative profitability of the mobile games market.
- Marginal profit in this case is a relative indicator. It is the difference between the total market value and the cost per install for a mobile game across all users, determined using the formula: Marginal profit = Market revenue – Number of users × CPI.
- The number of users is the number of mobile games users in a specific country.
- In this case, ARPU (Average Revenue Per User) is the average revenue per user per year. The data source for revenue, number of players, and ARPU is the Statista portal. The ARPU figure, highlighted in blue, is predicted to fall, while the rest will increase at various rates.
- CPI (Cost Per Install) is the average cost for a user to install a game of any genre for Android or iOS in every country which is standardized to 100%, disregarding other platforms. The data source for CPI, as of March 2019 for the games rating in 2018, is the Chartboost platform. Data for March 2019 marked in green was provided by the analytical company Niko Partners.
- Statistics on the breakdown of mobile users by OS on smartphones and tablets were published by the StatCounter online service.
- Language market size was calculated with data for all countries that speak the target language with regard to the proportion of target language speakers in each population.
FACTS ABOUT THE MOBILE GAMES MARKET IN 2018
In 2018, the video games market generated USD 137.9 billion. Revenue from mobile games grew from 36% of the total amount in 2017 to 41% in 2018. Forecasts predict this figure will continue to grow, reaching 49% by 2021 (according to Newzoo).
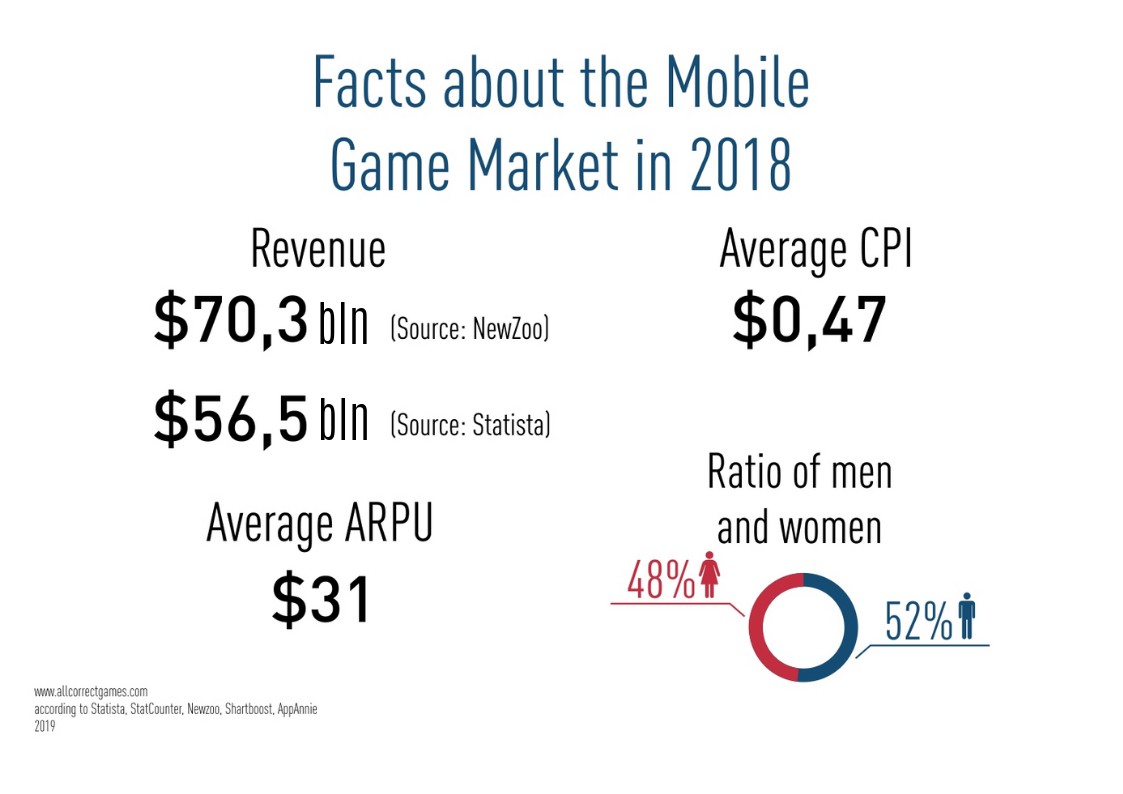
According to Chartboost, the average ARPU for 2018 was USD 31. The average CPI equaled USD 0.47.
As for the gender of mobile games users, there are slightly more men playing than women. In some countries, like the USA, there are considerably more women playing mobile games.
Several trends were observed in the mobile games market in 2018:
- Just like the year before, a large number of company mergers and acquisitions took place.
- Successful release of mobile games based on older games, franchises, and IP.
- Rapid growth of the Asian segment.
- Steady income growth from the Battle Royale and MOBA game genres.
- Development of e-sports and videogame streaming, including mobile games.
RESEARCH CHARACTERISTICS
For our research, we use data from Statista, App Annie, Priori Data, and Newzoo. It’s worth noting that the Statista portal corrected the data for some markets (India, Mexico, and USA) in 2017 and 2018, and these figures may change significantly. For some countries, the numbers from other sources such as Newzoo and App Annie may differ dramatically. Additionally, not a single analytics company has reliable data on the Chinese games market for Android for certain reasons.
In research like this, the profitability of the mobile games market is traditionally grouped by region (North America, Asia, Europe, etc.). Several countries are grouped together and examined as one.
However, we analyzed each country individually and ranked mobile games markets by attractiveness, a list that included 56 countries in 2019.
In addition, we endeavored to take into account the necessary costs for entering the market. To do so, we calculated the cost per install (CPI) for all users and subtracted it from the total income in each country. This allowed us to obtain data on the marginal profit for that market.
The term “users” is understood to mean active players (or accounts) registered in the chosen market.
These materials are intended for informational purposes only. The Allcorrect company does not bear any responsibility for potential losses or other negative consequences incurred by companies or individuals using this information for their business or for other purposes.
Allcorrect game localization studio
Localizing a game into the main languages increases its revenue by a factor of 1.9 (based on data from Google Europe and Allcorrect’s research).
Allcorrect is an ROI-based localization company. Our approach is based on finding profitable markets for developers and publishers and adapting games for target audiences, taking particular cultural aspects into account. Our goal is to make your games popular and your players happy.
We’ve been translating games since 2008, and we’ve localized over 968 projects during that time. Our portfolio includes localizations of large-scale AAA projects as well as indie games that have dominated the international market.


