
Discover the top 30 mobile game markets in 2025. Explore revenue rankings, growth trends, ARPU, and Allcorrect’s Market Opportunity Index across 29 key regions!
- Top Mobile Game Markets by Revenue (2022–2025)
- Mobile Game Markets in 2022–2025: What Has Changed
- The Outlook for the Mobile Markets in India and Africa
- Key Trends Shaping the Mobile Game Market in 2025
- Mobile Game Market Opportunity Index
- Which Markets Should Publishers Prioritize for Localization?
- From Market Opportunity to Player Experience
Top Mobile Game Markets by Revenue (2022–2025)
To understand where the mobile gaming industry is heading, it is important to look beyond a single year’s ranking.
The following table compares the world’s leading mobile game markets from 2022 to 2025, showing changes in revenue, audience size, ARPU, and platform distribution.
The data reveals a key industry shift: mature markets are increasingly growing through monetization, while emerging markets continue expanding primarily through audience growth.
Top Mobile Game Markets of 2025
| № | Region | Users | ARPU, USD | Revenue, USD | iOS | Android |
|---|---|---|---|---|---|---|
| 1 | China | 652M | $57.65 | $37.6B | 169M | 483M |
| 2 | United States | 161M | $150.84 | $24.2B | 101M | 59.4M |
| 3 | Japan | 57.1M | $209.26 | $12B | 36.6M | 20.6M |
| 4 | South Korea | 27.7M | $178.74 | $4.94B | 8.01M | 19.7M |
| 5 | Germany | 35.9M | $67.86 | $2.43B | 13.3M | 22.6M |
| 6 | United Kingdom | 30.8M | $78.78 | $2.42B | 16.1M | 14.7M |
| 7 | Indonesia | 144M | $11.20 | $1.61B | 14.6M | 129M |
| 8 | India | 408M | $3.47 | $1.42B | 27M | 381M |
| 9 | Brazil | 93.3M | $15.11 | $1.41B | 16M | 77.3M |
| 10 | Taiwan | 14.7M | $92.89 | $1.37B | 7.56M | 7.18M |
| 11 | Canada | 16.9M | $80.30 | $1.36B | 10.8M | 6.16M |
| 12 | France | 26.6M | $50.71 | $1.35B | 7.9M | 18.7M |
| 13 | Mexico | 64.7M | $19.27 | $1.25B | 15.5M | 49.2M |
| 14 | Australia | 10.8M | $101.87 | $1.1B | 6.57M | 4.27M |
| 15 | Italy | 25M | $39.87 | $996M | 8.72M | 16.3M |
| 16 | Turkey | 43.9M | $20.51 | $899M | 11.2M | 32.7M |
| 17 | Saudi Arabia | 20.1M | $43.11 | $866M | 7.46M | 12.6M |
| 18 | Thailand | 37M | $23.04 | $853M | 12.2M | 24.9M |
| 19 | Philippines | 63.9M | $11.27 | $720M | 9.93M | 54M |
| 20 | Malaysia | 22.7M | $29.99 | $682M | 7.31M | 15.4M |
| 21 | Spain | 25.5M | $22.40 | $570M | 7.16M | 18.3M |
| 22 | Vietnam | 53.2M | $10.63 | $565M | 21.5M | 31.6M |
| 23 | Poland | 15.5M | $35.68 | $554M | 3.98M | 11.5M |
| 24 | Netherlands | 7.92M | $66.24 | $524M | 3.41M | 4.51M |
| 25 | Iran | 42.7M | $10.60 | $453M | 6.02M | 36.7M |
| 26 | Switzerland | 4.01M | $107.51 | $431M | 2.23M | 1.78M |
| 27 | Hong Kong | 4.12M | $95.65 | $394M | 2.13M | 1.98M |
| 28 | Singapore | 3.65M | $104.06 | $380M | 1.43M | 2.22M |
| 29 | United Arab Emirates | 5.61M | $62.59 | $351M | 1.51M | 4.1M |
| 30 | Israel | 4.72M | $73.46 | $347M | 1.36M | 3.36M |
Top Mobile Game Markets of 2024
| № | Region | Users | ARPU, USD | Revenue, USD | iOS | Android |
|---|---|---|---|---|---|---|
| 1 | China | 646M | $51.78 | $33.4B | 169M | 477M |
| 2 | United States | 158M | $140.61 | $22.3B | 101M | 57.8M |
| 3 | Japan | 57M | $202.84 | $11.6B | 38.1M | 18.9M |
| 4 | South Korea | 26.9M | $163.93 | $4.41B | 8.35M | 18.5M |
| 5 | Germany | 33.9M | $63.26 | $2.15B | 13.1M | 20.9M |
| 6 | United Kingdom | 28.9M | $70.69 | $2.05B | 15.5M | 13.4M |
| 7 | Indonesia | 138M | $10.86 | $1.5B | 14.7M | 124M |
| 8 | Taiwan | 14.2M | $91.90 | $1.31B | 7.36M | 6.87M |
| 9 | Brazil | 89M | $14.26 | $1.27B | 17.2M | 71.7M |
| 10 | India | 376M | $3.37 | $1.27B | 23.7M | 353M |
| 11 | Canada | 16.3M | $76.71 | $1.25B | 10.4M | 5.85M |
| 12 | Mexico | 62.4M | $18.93 | $1.18B | 16.1M | 46.3M |
| 13 | France | 27M | $43.36 | $1.17B | 8.71M | 18.3M |
| 14 | Australia | 10.2M | $99.33 | $1.01B | 6.35M | 3.84M |
| 15 | Italy | 25.2M | $35.85 | $902M | 8.88M | 16.3M |
| 16 | Thailand | 35M | $21.94 | $769M | 11.9M | 23.2M |
| 17 | Turkey | 43.2M | $16.50 | $713M | 10.4M | 32.9M |
| 18 | Saudi Arabia | 19.9M | $35.78 | $711M | 8.12M | 11.8M |
| 19 | Philippines | 61.5M | $10.84 | $667M | 11M | 50.5M |
| 20 | Malaysia | 21.8M | $27.91 | $610M | 7.04M | 14.8M |
| 21 | Spain | 24.8M | $20.90 | $518M | 6.92M | 17.9M |
| 22 | Vietnam | 51.5M | $9.94 | $512M | 20.4M | 31.1M |
| 23 | Poland | 15.7M | $29.46 | $463M | 3.59M | 12.1M |
| 24 | Netherlands | 7.53M | $60.01 | $452M | 3.38M | 4.16M |
| 25 | Hong Kong | 4.07M | $100.92 | $411M | 2.17M | 1.91M |
| 26 | Iran | 41M | $9.91 | $407M | 5.36M | 35.6M |
| 27 | Switzerland | 3.83M | $98.83 | $378M | 2.17M | 1.66M |
| 28 | Singapore | 3.39M | $104.97 | $356M | 1.36M | 2.03M |
| 29 | Israel | 4.56M | $66.53 | $303M | 1.35M | 3.21M |
| 30 | Argentina | 22.9M | $13.08 | $299M | 3.19M | 19.7M |
Top Mobile Game Markets of 2023
| № | Region | Users | ARPU, USD | Revenue, USD | iOS | Android |
|---|---|---|---|---|---|---|
| 1 | China | 648M | $50.05 | $32.4B | 176M | 472M |
| 2 | United States | 152M | $133.47 | $20.2B | 96.4M | 55.1M |
| 3 | Japan | 57.9M | $202.78 | $11.7B | 40.6M | 17.3M |
| 4 | South Korea | 27.3M | $158.66 | $4.33B | 9.12M | 18.2M |
| 5 | Germany | 31.9M | $58.80 | $1.87B | 13M | 18.9M |
| 6 | United Kingdom | 26.9M | $63.76 | $1.71B | 14.9M | 11.9M |
| 7 | Indonesia | 133M | $10.71 | $1.43B | 14.7M | 118M |
| 8 | Taiwan | 14.7M | $90.09 | $1.32B | 7.34M | 7.35M |
| 9 | Canada | 15.4M | $76.15 | $1.17B | 9.82M | 5.54M |
| 10 | Brazil | 83.8M | $13.73 | $1.15B | 18.1M | 65.7M |
| 11 | India | 363M | $3.10 | $1.12B | 21.9M | 341M |
| 12 | Mexico | 60.2M | $17.71 | $1.07B | 16.5M | 43.7M |
| 13 | France | 25.6M | $39.21 | $1B | 9.47M | 16.1M |
| 14 | Australia | 9.51M | $100.34 | $954M | 6.07M | 3.44M |
| 15 | Italy | 24.2M | $32.41 | $785M | 8.57M | 15.6M |
| 16 | Thailand | 33.9M | $21.26 | $722M | 11.6M | 22.4M |
| 17 | Philippines | 59.7M | $10.33 | $617M | 11M | 48.7M |
| 18 | Saudi Arabia | 19.7M | $30.14 | $594M | 9.14M | 10.6M |
| 19 | Turkey | 44.5M | $13.05 | $580M | 9.56M | 34.9M |
| 20 | Malaysia | 21M | $27.07 | $568M | 6.63M | 14.3M |
| 21 | Vietnam | 50.7M | $9.61 | $487M | 19.4M | 31.3M |
| 22 | Spain | 24M | $18.95 | $454M | 6.66M | 17.3M |
| 23 | Hong Kong | 4.23M | $104.99 | $444M | 2.23M | 2M |
| 24 | Netherlands | 6.86M | $56.14 | $385M | 3.19M | 3.67M |
| 25 | Poland | 14.5M | $26.21 | $380M | 2.72M | 11.8M |
| 26 | Iran | 39M | $8.72 | $340M | 4.68M | 34.3M |
| 27 | Switzerland | 3.58M | $92.12 | $329M | 2.10M | 1.47M |
| 28 | Singapore | 3.39M | $93.01 | $315M | 1.32M | 2.07M |
| 29 | Argentina | 22M | $12.82 | $282M | 2.69M | 19.3M |
| 30 | Israel | 4.37M | $58.34 | $255M | 1.33M | 3.04M |
Top Mobile Game Markets of 2022
| № | Region | Users | ARPU, USD | Revenue, USD | iOS | Android |
|---|---|---|---|---|---|---|
| 1 | China | 650M | $49.49 | $32.2B | 173M | 477M |
| 2 | United States | 144M | $139.19 | $20B | 91.2M | 52.4M |
| 3 | Japan | 57.6M | $218.50 | $12.6B | 40.7M | 16.9M |
| 4 | South Korea | 27.3M | $168.97 | $4.61B | 8.97M | 18.3M |
| 5 | Germany | 29.8M | $61.96 | $1.85B | 12.2M | 17.6M |
| 6 | United Kingdom | 24.9M | $67.11 | $1.67B | 14.1M | 10.9M |
| 7 | Indonesia | 123M | $11.82 | $1.46B | 11.5M | 112M |
| 8 | Taiwan | 14.8M | $92.34 | $1.36B | 7.15M | 7.6M |
| 9 | Canada | 14.4M | $84.02 | $1.21B | 8.96M | 5.45M |
| 10 | Brazil | 80M | $14.31 | $1.15B | 15.5M | 64.5M |
| 11 | India | 341M | $3.33 | $1.14B | 19.4M | 322M |
| 12 | Australia | 9.19M | $107.52 | $988M | 5.80M | 3.39M |
| 13 | France | 24.4M | $40.40 | $986M | 9.36M | 15.1M |
| 14 | Mexico | 57.1M | $17.27 | $986M | 14.3M | 42.8M |
| 15 | Italy | 24.3M | $31.22 | $760M | 8.07M | 16.3M |
| 16 | Thailand | 32M | $21.55 | $689M | 10.3M | 21.7M |
| 17 | Malaysia | 19.7M | $30.34 | $598M | 5.85M | 13.8M |
| 18 | Philippines | 56.3M | $10.61 | $597M | 9.66M | 46.6M |
| 19 | Saudi Arabia | 19.4M | $29.35 | $570M | 9.42M | 9.99M |
| 20 | Turkey | 41.7M | $12.64 | $527M | 8.55M | 33.2M |
| 21 | Vietnam | 50.5M | $9.88 | $499M | 18.9M | 31.7M |
| 22 | Hong Kong | 4.19M | $109.46 | $458M | 2.14M | 2.04M |
| 23 | Spain | 23.7M | $18.59 | $440M | 6.44M | 17.2M |
| 24 | Poland | 13.9M | $27.38 | $380M | 2.08M | 11.8M |
| 25 | Netherlands | 5.98M | $62.68 | $375M | 2.79M | 3.19M |
| 26 | Singapore | 3.16M | $108.48 | $343M | 1.22M | 1.94M |
| 27 | Iran | 38.8M | $8.76 | $340M | 4.24M | 34.6M |
| 28 | Switzerland | 3.37M | $94.55 | $319M | 2.01M | 1.36M |
| 29 | Argentina | 21.1M | $14.52 | $306M | 2.31M | 18.8M |
| 30 | Israel | 4.41M | $60.56 | $267M | 1.31M | 3.11M |
Russia is excluded from the main ranking because its post-2022 mobile gaming revenue is no longer fully comparable with standard App Store / Google Play datasets. However, the market remains significant by audience and engagement. Store-level estimates show Russia among the leading countries by downloads but much lower by IAP revenue, while local studies point to a broader mobile gaming market of over USD 1 billion.
Mobile Game Markets in 2022–2025: What Has Changed
Key Developments of 2022–2025
Total revenue across the top 30 markets rose from USD 89.7 billion to USD 104 billion (+16%), but growth was uneven over time: in 2023, the market dipped to USD 89 billion, remained near that level for another year, and only accelerated sharply between 2024 and 2025. In fact, the market stood still for two years, with all growth occurring over the past year and a half.
Market concentration remained unchanged: China and the US together still account for about 59% of the total revenue of the top 30. However, the balance shifted within the pair of leaders—the US grew faster (from USD 20 billion to USD 24.2 billion, +21% over four years), partly due to audience growth (+12%), whereas China (from USD 32.2 billion to USD 37.6 billion, +17%) grew almost exclusively due to improved monetization, with virtually no audience growth (from 650 million to 652 million).
Japan is the only major market to post a decline for the period: revenue fell from USD 12.6 billion to USD 12 billion (-5%), and ARPU dropped from USD 218 to USD 209. A partial rebound from the 2023–2024 lows is visible in 2025, but pre-crisis levels have not yet been reached. Given the weak yen, revenue in dollars declined.
Trends in the Mobile Gaming Markets:
- Saturated markets (China, Japan, South Korea) are growing solely due to ARPU—their user base is stagnating.
- Emerging markets (India, Indonesia, Brazil, the Philippines) are growing in terms of user base, with low and, in some cases, declining ARPU. Indonesia is a prime example: the number of users grew by +17% over four years, but ARPU fell from USD 11.82 to USD 11.20, never returning to its 2022 levels.
- Europe is showing the healthiest growth across both metrics: the UK saw a 45% increase in revenue over four years, and Germany saw a 31% increase. Both markets added more than 20% to their user bases during this period.
Turkey saw the largest revenue growth: ARPU rose from USD 12.64 to USD 20.51 (+62%), and revenue soared by +71% with virtually no growth in the user base. The MENA region showed similar trends: Saudi Arabia saw a 52% increase in revenue, and ARPU rose from USD 29 to USD 43. What contributed to this? The government promotion of gaming, economic growth, and a young population that’s gradually achieving financial stability and beginning to spend—including on games.
In terms of revenue distribution across platforms, the balance of power has remained virtually unchanged. iOS’s share among the top 30 markets remained at ~27%. However, the revenue split remains different: Android attracts users in emerging markets, while iOS generates revenue in “wealthy” markets.
The Outlook for the Mobile Markets in India and Africa
India saw the largest absolute increase in audience size during the period (+67 million people, rising from 341 million to 408 million), but its ARPU remains the lowest in the table—about USD 3.5. Revenue from the App Store and Google Play is around USD 1.42 billion, meaning that a country with 408 million players generates less revenue than the 31 million players in the UK. There’s still no real money to be made there.
It’s important to note that the table shows IAP revenue. Real-money gaming (fantasy sports, rummy, etc.) is a separate story, as it operates outside the app stores.
This sector was targeted by the PROGA Act in August 2025, which took effect on May 1, 2026, and effectively wiped out India’s RMG industry—worth about USD 3.5 billion—leading to mass layoffs. Forecasts for mobile gaming in India are optimistic, but monetization remains a bottleneck: the upside here lies in the advertising model and in rising incomes among the middle class.
Africa is not in the top 30. However, the continent’s entire gaming market was estimated at approximately USD 2.29 billion in 2025, with over 95% on mobile at 349 million players. The growth drivers are the same as those in India a decade ago: cheap 4G data, mobile wallets instead of cards, and a young audience. Growth rates (~12% per year) exceed the global average. But the challenges are the same as those in India—namely, everything related to monetization.
Key Trends Shaping the Mobile Game Market in 2025
The main trend in recent years is that the market has reached maturity in terms of audience size and has begun to grow in revenue through monetization. In major developed countries, the growth of new audiences has nearly come to a halt.
The future billions of users—in India, Africa, and Southeast Asia—are, for now, markets with large audiences that are not yet being actively monetized.
Growth in 2024–2025 was largely driven by currency fluctuations and inflation. If we adjust for inflation, the gaming markets in many countries aren’t merely stagnating but declining.
Mature markets are entering a phase where revenue growth is driven by monetization: there are no new players to attract, so the only option is to squeeze more out of each existing one. Japan shows that this model has its limits—its ARPU has already started to decline. This trend needs to be monitored closely. This explains the trend toward D2C revenue in recent years.
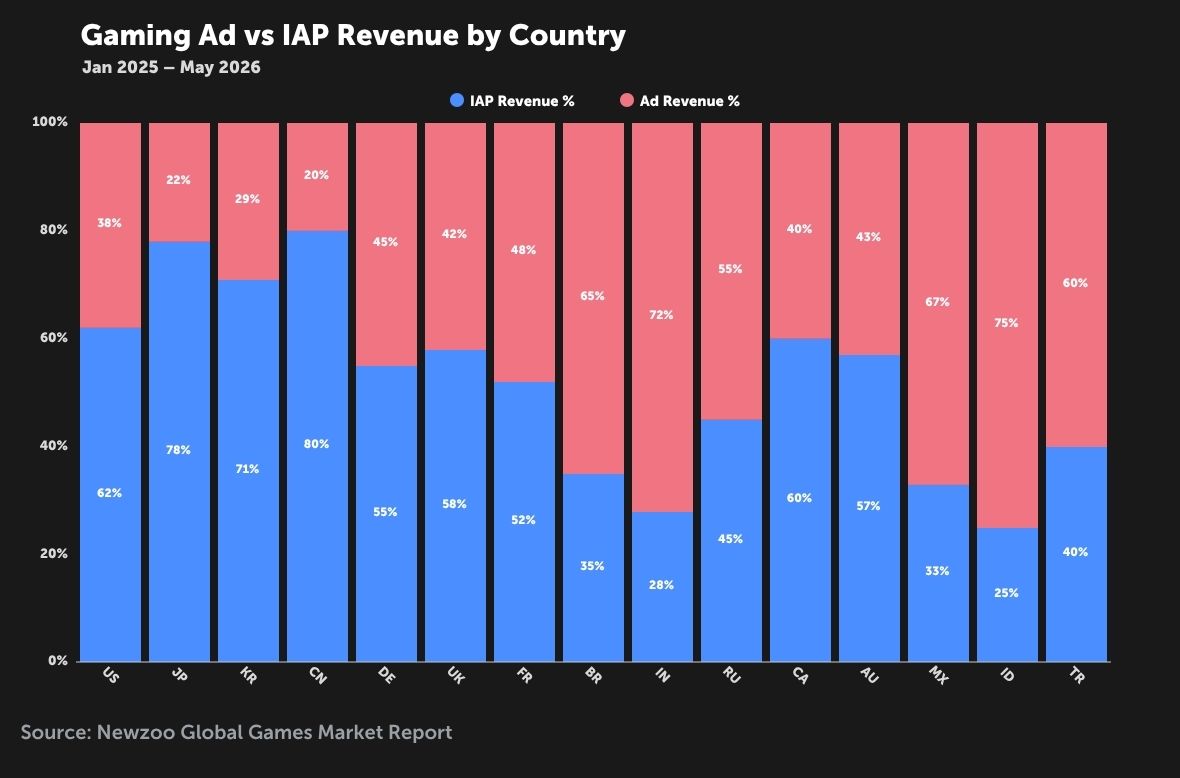
Another important point: mobile game monetization models vary significantly by region, so it’s crucial for publishers to consider the specifics of each market and avoid applying a one-size-fits-all approach to all audiences. According to research by Sensor Tower, in emerging markets—including India, Indonesia, and Brazil—in-game advertising accounts for a significant portion of total revenue, representing approximately 55–70%. At the same time, in more mature markets with high user purchasing power—such as the US, Canada, South Korea, and Japan—the situation is different. In-app purchases are the primary source of revenue, accounting for about 77–90% of total revenue.
Mobile Game Market Opportunity Index
To help publishers prioritize markets for localization and launch, we introduced the Allcorrect Mobile Game Market Opportunity Index—a multi-factor scoring model that measures both commercial potential and practical entry barriers. The model combines market size, ARPU, revenue growth, audience growth, and estimated market accessibility. It is designed to show not just where the biggest mobile game markets are, but also which markets offer the strongest balance of scale, monetization, growth, and accessibility.
More about Market Accessibility. Market accessibility is based on Allcorrect’s expert assessment of current market conditions, including regulatory environment, platform accessibility, localization complexity, and entry barriers. As these factors may change due to new laws, restrictions, or market developments, the score should be viewed as a dynamic indicator.
100 points = A relatively easy market to enter, with straightforward distribution, familiar platforms like the App Store and Google Play, and low language and cultural barriers.
0 points = A very complex market, with licensing requirements, the need for a local partner, payment restrictions, fragmentation of Android stores, and sanctions or regulatory risks. For example, China receives a low score because the market requires a separate publishing approach. India received a moderate score due to regulatory uncertainty affecting certain segments of the gaming ecosystem, as well as issues related to monetization and market fragmentation.
To create the Allcorrect Mobile Game Market Opportunity Index, we used a weighted scoring model. Each market was evaluated across five key factors, with weights assigned according to their importance for mobile game publishers. Revenue size received the highest weight (35%) as an indicator of proven commercial potential, while ARPU, revenue growth, audience growth, and market accessibility were included to capture monetization potential, market dynamics, and the practical complexity of expansion.
| Factor | Weight |
|---|---|
| Revenue Size (2025) | 35% |
| ARPU (2025) | 20% |
| Revenue Growth (2022–2025) | 20% |
| Audience Growth (2022–2025) | 10% |
| Market Accessibility | 15% |
The final score represents a weighted average of all five factors, with each market receiving a score from 0 to 100.
Mobile Game Markets Ranked by Opportunity Index (2025)
| Rank | Region | Revenue 2025 |
ARPU 2025 |
Revenue Growth 22–25 |
Audience Growth 22–25 |
Accessibility | Score |
|---|---|---|---|---|---|---|---|
| 1 | United States | $24.2B | $150.84 | +21% | +12% | 95 | 78.4 |
| 2 | United Kingdom | $2.42B | $78.78 | +45% | +24% | 92 | 76.9 |
| 3 | China | $37.6B | $57.65 | +17% | +0.3% | 25 | 71.8 |
| 4 | Germany | $2.43B | $67.86 | +31% | +21% | 80 | 71.2 |
| 5 | Japan | $12B | $209.26 | -5% | -1% | 60 | 68.5 |
| 6 | South Korea | $4.94B | $178.74 | +7% | +2% | 60 | 64.8 |
| 7 | Canada | $1.36B | $80.30 | +12% | +17% | 90 | 62.1 |
| 8 | Australia | $1.1B | $101.87 | +11% | +18% | 90 | 60.9 |
| 9 | France | $1.35B | $50.71 | +37% | +9% | 78 | 58.5 |
| 10 | Brazil | $1.41B | $15.11 | +23% | +17% | 75 | 54.4 |
| 11 | Italy | $996M | $39.87 | +31% | +3% | 80 | 52.9 |
| 12 | India | $1.42B | $3.47 | +25% | +20% | 55 | 52.3 |
| 13 | Saudi Arabia | $866M | $43.11 | +52% | +4% | 60 | 52.2 |
| 14 | Netherlands | $524M | $66.24 | +40% | +32% | 85 | 51.8 |
| 15 | Turkey | $899M | $20.51 | +71% | +5% | 65 | 51.7 |
| 16 | Indonesia | $1.61B | $11.20 | +10% | +17% | 65 | 50.9 |
| 17 | Mexico | $1.25B | $19.27 | +27% | +13% | 78 | 50.6 |
| 18 | Taiwan | $1.37B | $92.89 | +1% | -1% | 70 | 50.1 |
| 19 | Poland | $554M | $35.68 | +46% | +12% | 82 | 49.8 |
| 20 | Switzerland | $431M | $107.51 | +35% | +19% | 84 | 49.7 |
| 21 | Thailand | $853M | $23.04 | +24% | +16% | 68 | 49.3 |
| 22 | Spain | $570M | $22.40 | +30% | +8% | 82 | 47.8 |
| 23 | Malaysia | $682M | $29.99 | +14% | +15% | 75 | 46.7 |
| 24 | Singapore | $380M | $104.06 | +11% | +16% | 85 | 45.8 |
| 25 | Philippines | $720M | $11.27 | +21% | +14% | 78 | 45.4 |
| 26 | Israel | $347M | $73.46 | +30% | +7% | 78 | 43.7 |
| 27 | Vietnam | $565M | $10.63 | +13% | +5% | 40 | 35.3 |
| 28 | Iran | $453M | $10.60 | +33% | +10% | 55 | 35.1 |
| 29 | Hong Kong | $394M | $95.65 | -14% | -2% | 78 | 34.8 |
The UAE entered the Top Mobile Game Markets ranking in 2025, replacing Argentina in the top 30 by revenue. However, the country is excluded from the Market Opportunity Index because historical comparable data for 2022–2024 is unavailable in our dataset. Despite its relatively small audience, the UAE stands out because of high purchasing power and strong monetization potential. The market is strategically important as part of the broader MENA region, where localization into Arabic can unlock multiple countries.
This material is provided for informational purposes only. The Allcorrect Mobile Game Market Opportunity Index is based on publicly available data and expert assessments of current market conditions. Market conditions, regulations, and industry restrictions may change over time and affect the relevance of these insights. Allcorrect does not bear responsibility for any decisions, losses, or other consequences resulting from the use of this information.
Which Markets Should Publishers Prioritize for Localization?
Entering a new market requires more than translating game content. Localization strategy should consider revenue potential, player expectations, cultural nuances, and the complexity of adapting the game experience for local audiences.
Based on our market analysis, we identified priority languages and regions where localization can have the greatest impact on mobile game growth.
| Language | Main Markets Covered | Business Opportunity | Localization Priority |
|---|---|---|---|
| English | Tier 1: US, UK, Canada, Australia, Netherlands Tier 2: India (to some extent), the Philippines, and some African countries |
Tier 1: The largest premium markets, highest monetization potential, global reach Tier 2: Access to rapidly growing player bases with lower monetization today, but strong long-term market potential |
Must-have |
| Simplified Chinese | China, Singapore | Access to the world’s largest mobile gaming market and Chinese-speaking audiences. Requires dedicated localization and publishing strategy | Strategic priority |
| Traditional Chinese | Taiwan, Hong Kong | Important for mature, high-value Chinese-speaking markets with strong localization expectations | High priority |
| Japanese | Japan | A premium market with one of the highest ARPU levels and strong expectations for localized content | Premium localization |
| Korean | South Korea | A high-spending audience with a strong RPG/MMO segment | High-value market |
| German | Germany, Switzerland | Strong European markets with high purchasing power and mature gaming audiences | High priority |
| French | France, Canada, parts of Europe and Africa | Expands across multiple regions | Medium to high priority |
| Italian | Italy | A mature European mobile gaming market with strong localization expectations among players | Medium to high priority |
| Spanish | Spain, Latin America, part of the US | A large combined audience and strong growth potential across several markets | High priority |
| Brazilian Portuguese | Brazil | The largest gaming market in Latin America with a large mobile player base | Strategic growth |
| Hindi / Indian English | India (India does not have a single official language) | One of the world’s largest mobile gaming audiences with strong user growth, but lower monetization compared to mature markets | Selective / growth-focused localization |
| Arabic | Saudi Arabia, UAE, other MENA countries (in every country, Arabic has its own regional characteristics) | Growing investment in gaming and increasing importance of MENA markets | Strategic growth |
| Indonesian | Indonesia, Southeast Asia | A large and growing player base, but monetization requires careful market evaluation | Selective localization |
Localization priorities don’t always correspond directly to official languages. In some markets, such as the Netherlands, English can provide broad coverage due to high player proficiency, while other markets require dedicated local-language adaptation to meet player expectations.
While English can serve as the starting language for global releases, game localization goes beyond translation. To ensure a consistent and positive player experience across markets, publishers should consider localization quality assurance (LQA) to identify linguistic, cultural, and functional issues before launch. Localization testing helps verify that localized content feels natural, fits the game context, and works correctly across different devices and platforms.
From Market Opportunity to Player Experience
A successful global launch requires more than entering a high-potential market. Publishers need to balance market opportunity with the right localization strategy—from choosing the appropriate languages to ensuring quality through LQA. By combining market insights with a player-focused approach, studios can improve user experience and increase the chances of long-term success in new regions.
Revenue size alone doesn’t tell you where to launch next—monetization model, growth trajectory, and entry barriers matter just as much.
Allcorrect combines market data with hands-on localization and LQA expertise to help publishers decide where to launch and how to adapt the game for each audience.


